
Agent Performance reportUpdated 2 months ago
You can use the Agents performance report to evaluate the effectiveness of your agents over a specific period of time.
By comparing detailed performance metrics for each individual agent, team leaders can distribute work more efficiently and identify areas where team members can improve.
In the report, you’ll find industry-standard metrics for customer support, including satisfaction scores, first response time, resolution time, ticket handle time, message sent, one-touch tickets, and more. The report also includes performance metrics for AI Agent.
Requirements
- Any role in Gorgias can view this report
- Only Team Leads and Admins can download data
Open and filter data in the report
Open AI Agent Support report in your Statistics. Use the filters to adjust and change your view of the data.
- Go to Statistics from the main menu
- Under the Support Performance section, select Agents to open the report
- Open the Date filter to adjust the report’s time frame
- Choose a preset date range (for example, 7/30/60/90 days) or use the calendars to select a custom date range
.webp)
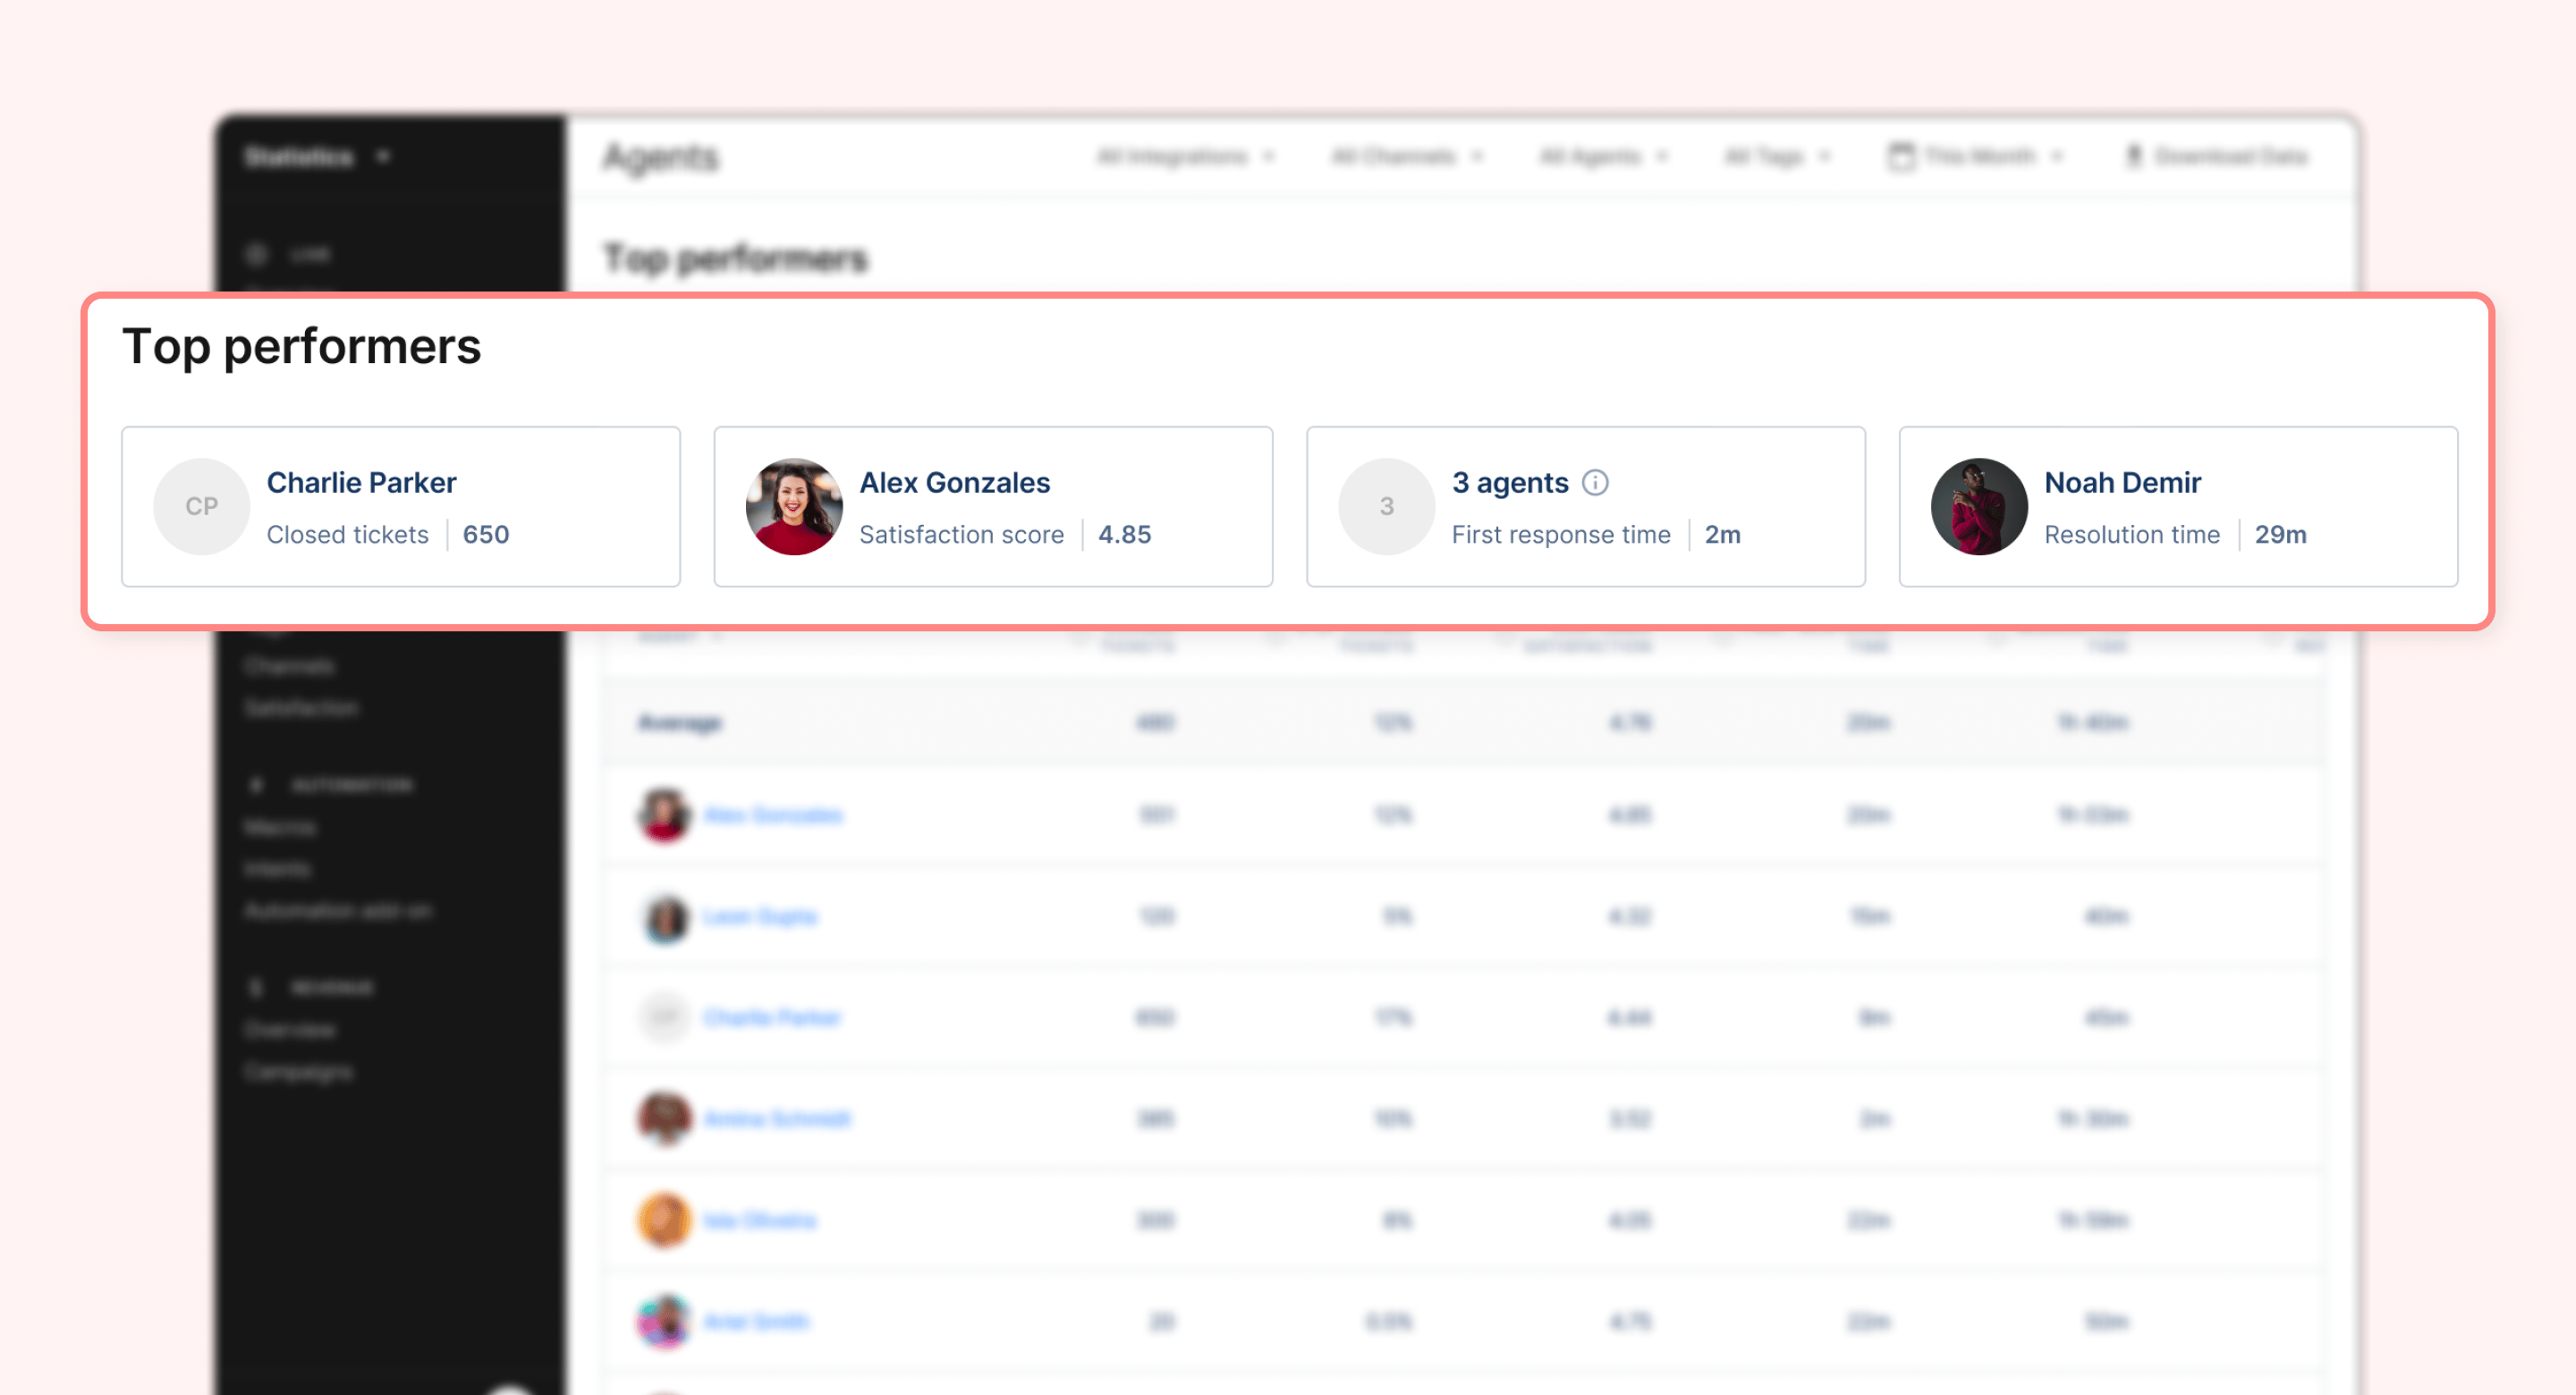
Top performers
The Top performers section appears at the top of the report when you have 3 or more agents. At a glance, you can see the follow metrics for top performers:
- Customer satisfaction (max)
- First response time (min)
- Resolution time (min)
- Number of closed tickets (max)
Agent performance metrics
This Performance section contains key metrics for evaluating each agent's performance, such as customer satisfaction scores, first response time, resolution time, and the number of tickets closed or replied to.
At the top of the chart, you can see the Average and Total results for agents included in the chart. Learn more about how averages and totals are calculated.
You can also customize the Performance chart to focus on metrics that matter most to your team. Select the header of any column in the chart to sort results by ascending or descending order.
<image>
Here’s a breakdown of each of the metrics for Agent Performance:
| Metric | Definition |
| Closed tickets | Number of unique closed tickets within the selected timeframe (that did not reopen), assigned to selected agent(s)/team(s) |
| % of closed tickets | The percentage of closed tickets assigned to the agent compared to the total number of closed tickets assigned to all agents (excludes unassigned closed tickets) |
| Average CSAT | Average CSAT score for tickets assigned to the agent for which a survey was sent within the timeframe; surveys are sent following ticket resolution |
| Tickets Replied | Number of unique tickets where the agent sent a message within the selected timeframe |
| Messages sent | Total number of messages sent by the agent within the selected timeframe |
| First response time | Median time between the first customer message and first agent response, for tickets where the response was sent within the selected timeframe |
| Resolution time | Median time between first customer message and the last time the ticket was closed, for tickets closed within the selected timeframe |
| One-touch tickets | Percentage of closed tickets assigned to the agent with exactly 1 message sent by the agent (or rule). |
| Online time | The total amount of time the agent spent on Gorgias during the selected timeframe. This metric is calculated by measuring the amount of time the agent has had Gorgias open in an active desktop browser tab. At the moment, we do not track Online for the Gorgias mobile app. |
| Messages sent per hour | Number of messages sent by the agent divided by the number of online hours |
| Tickets replied by hour | Number of tickets replied by the agent divided by the number of online hours |
| Closed tickets per hour | Number of closed tickets assigned to the agent divided by the number of online hours |
| Ticket handle time | Average amount of time spent by any agent on the closed tickets assigned to the agent |
| Average response time | Average time between all customer and agent messages in tickets assigned to the agent |
| Messages received | Number of messages received within the selected timeframe |
| Zero touch tickets | Number of tickets closed without agent reply |
Edit the Agent Performance table
Note: only Admins can edit the columns in this table
Admins can customize the Agent performance table to focus on the metrics that matter most to your team. Changes to the chart are saved for any other roles who view this report.
- Select the Edit Table button
- Use the checkboxes in the menu to add and remove metrics from the table
- To change the order of metrics, click and drag the handle (6 dots) next to a metrics’ name
- Select Save to update the chart for all viewers
.webp)
How averages and totals are calculated
Admins may customize the Agent performance chart to include Average and Total rows.
You can use the Average and Total row to better understand the overall performance of your team, as opposed to the performance of individual team members.
.webp)
Depending on the metric, the Average row is not always a simple average of all agents.
- For simple count metrics (e.g., tickets closed, replies), we calculate the average across all agents shown.
- For aggregated metrics per agent (e.g., CSAT, FRT, RT), averages or medians are based on all tickets handled by the displayed agents, not the average per agent.
- CSAT is the average of all scores received by the displayed agents.
- FRT and RT are the median times across tickets handled by these agents.
Totals apply to ticket-based metrics that can be added together. For example, the total for Closed Tickets adds together the number of tickets that each agent closed during the selected timeframe. Totals exclude unassigned tickets.
You’ll find totals for the following ticket-based metrics:
- Closed tickets
- Closed tickets per hour
- Tickets replied
- Tickets replied per hour
- Messages sent
- Messages sent per hour
