Automate Overview Performance sectionUpdated a year ago
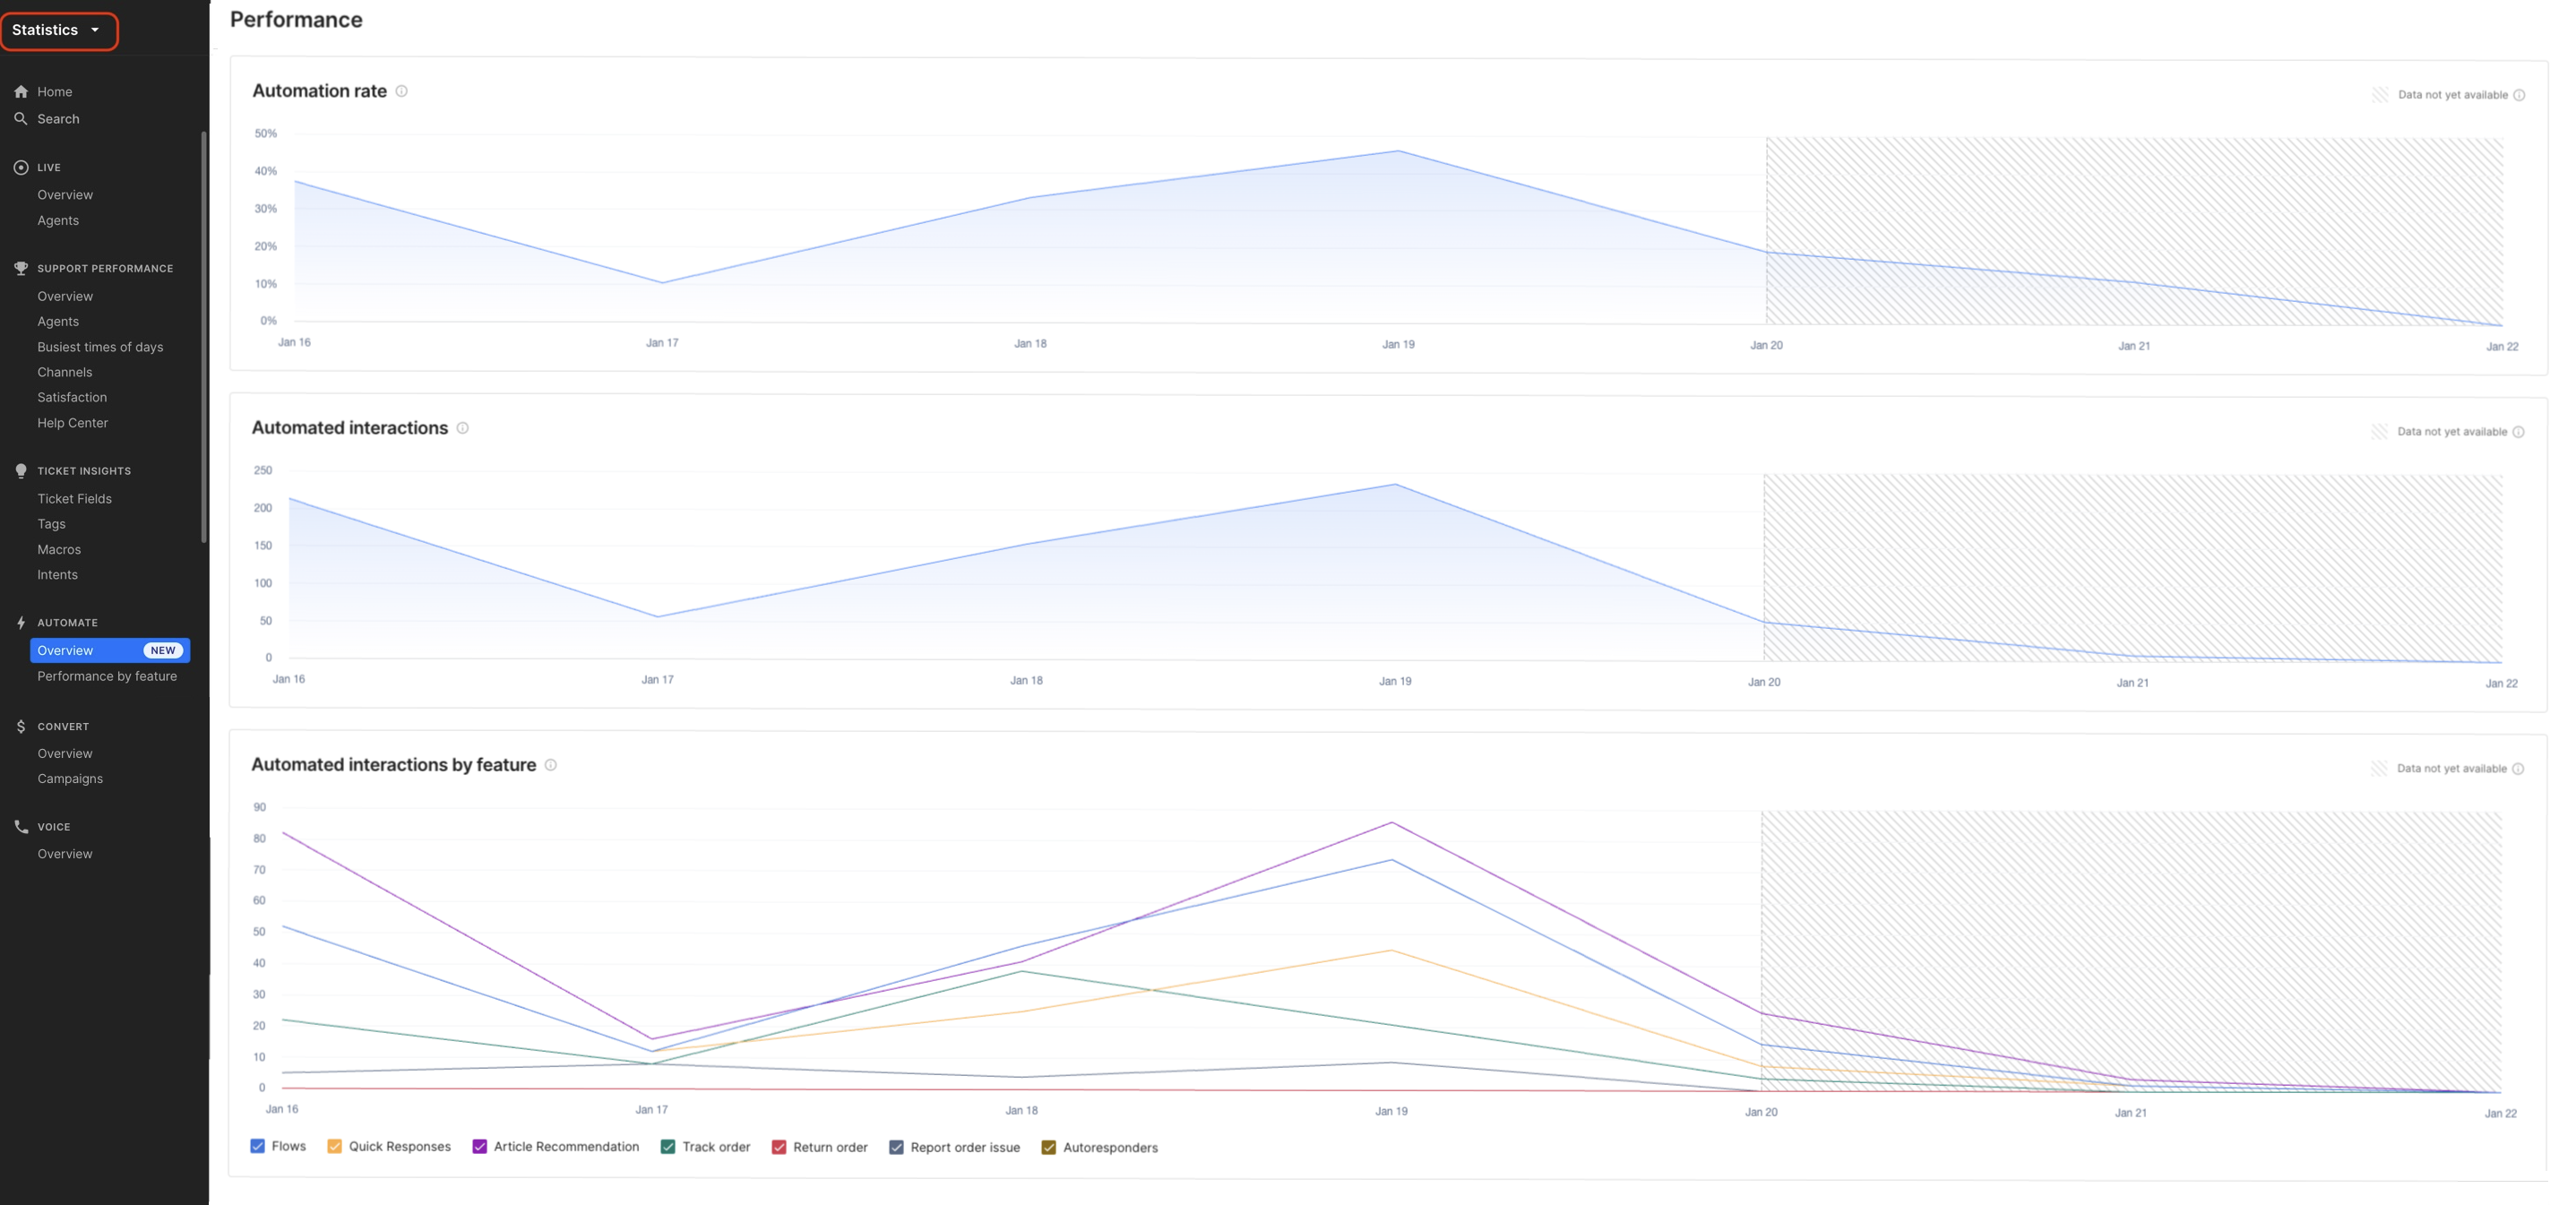
This part of the Automate Overview identifies periods when automation increases or decreases and reveals seasonal variation or recurring patterns, thus providing data for planning and adjusting strategies.
It won't include data for the past 72 hours - this will be marked on the right side of the graphs as Data not yet available.

Automation rate graph
This chart displays the percentage of how many of your total customer interactions have been fully automated in smaller time increments of your selected period.
Automated interactions graph
This chart shows the number of automated interactions over time. An interaction is automated when customers solve their requests without human intervention using a Gorgias Automate feature.
Automated interactions by feature graph
This chart reveals the contribution of each Automate feature over the selected period of time and drills down Order Management options. The Cancel order option won't be displayed as it can't automate any interactions - it'll always create a ticket that needs to be handled by an agent.