Drill-downUpdated 9 days ago
If you want to find out why a metric has a certain value, you can see the tickets that were used in computing.
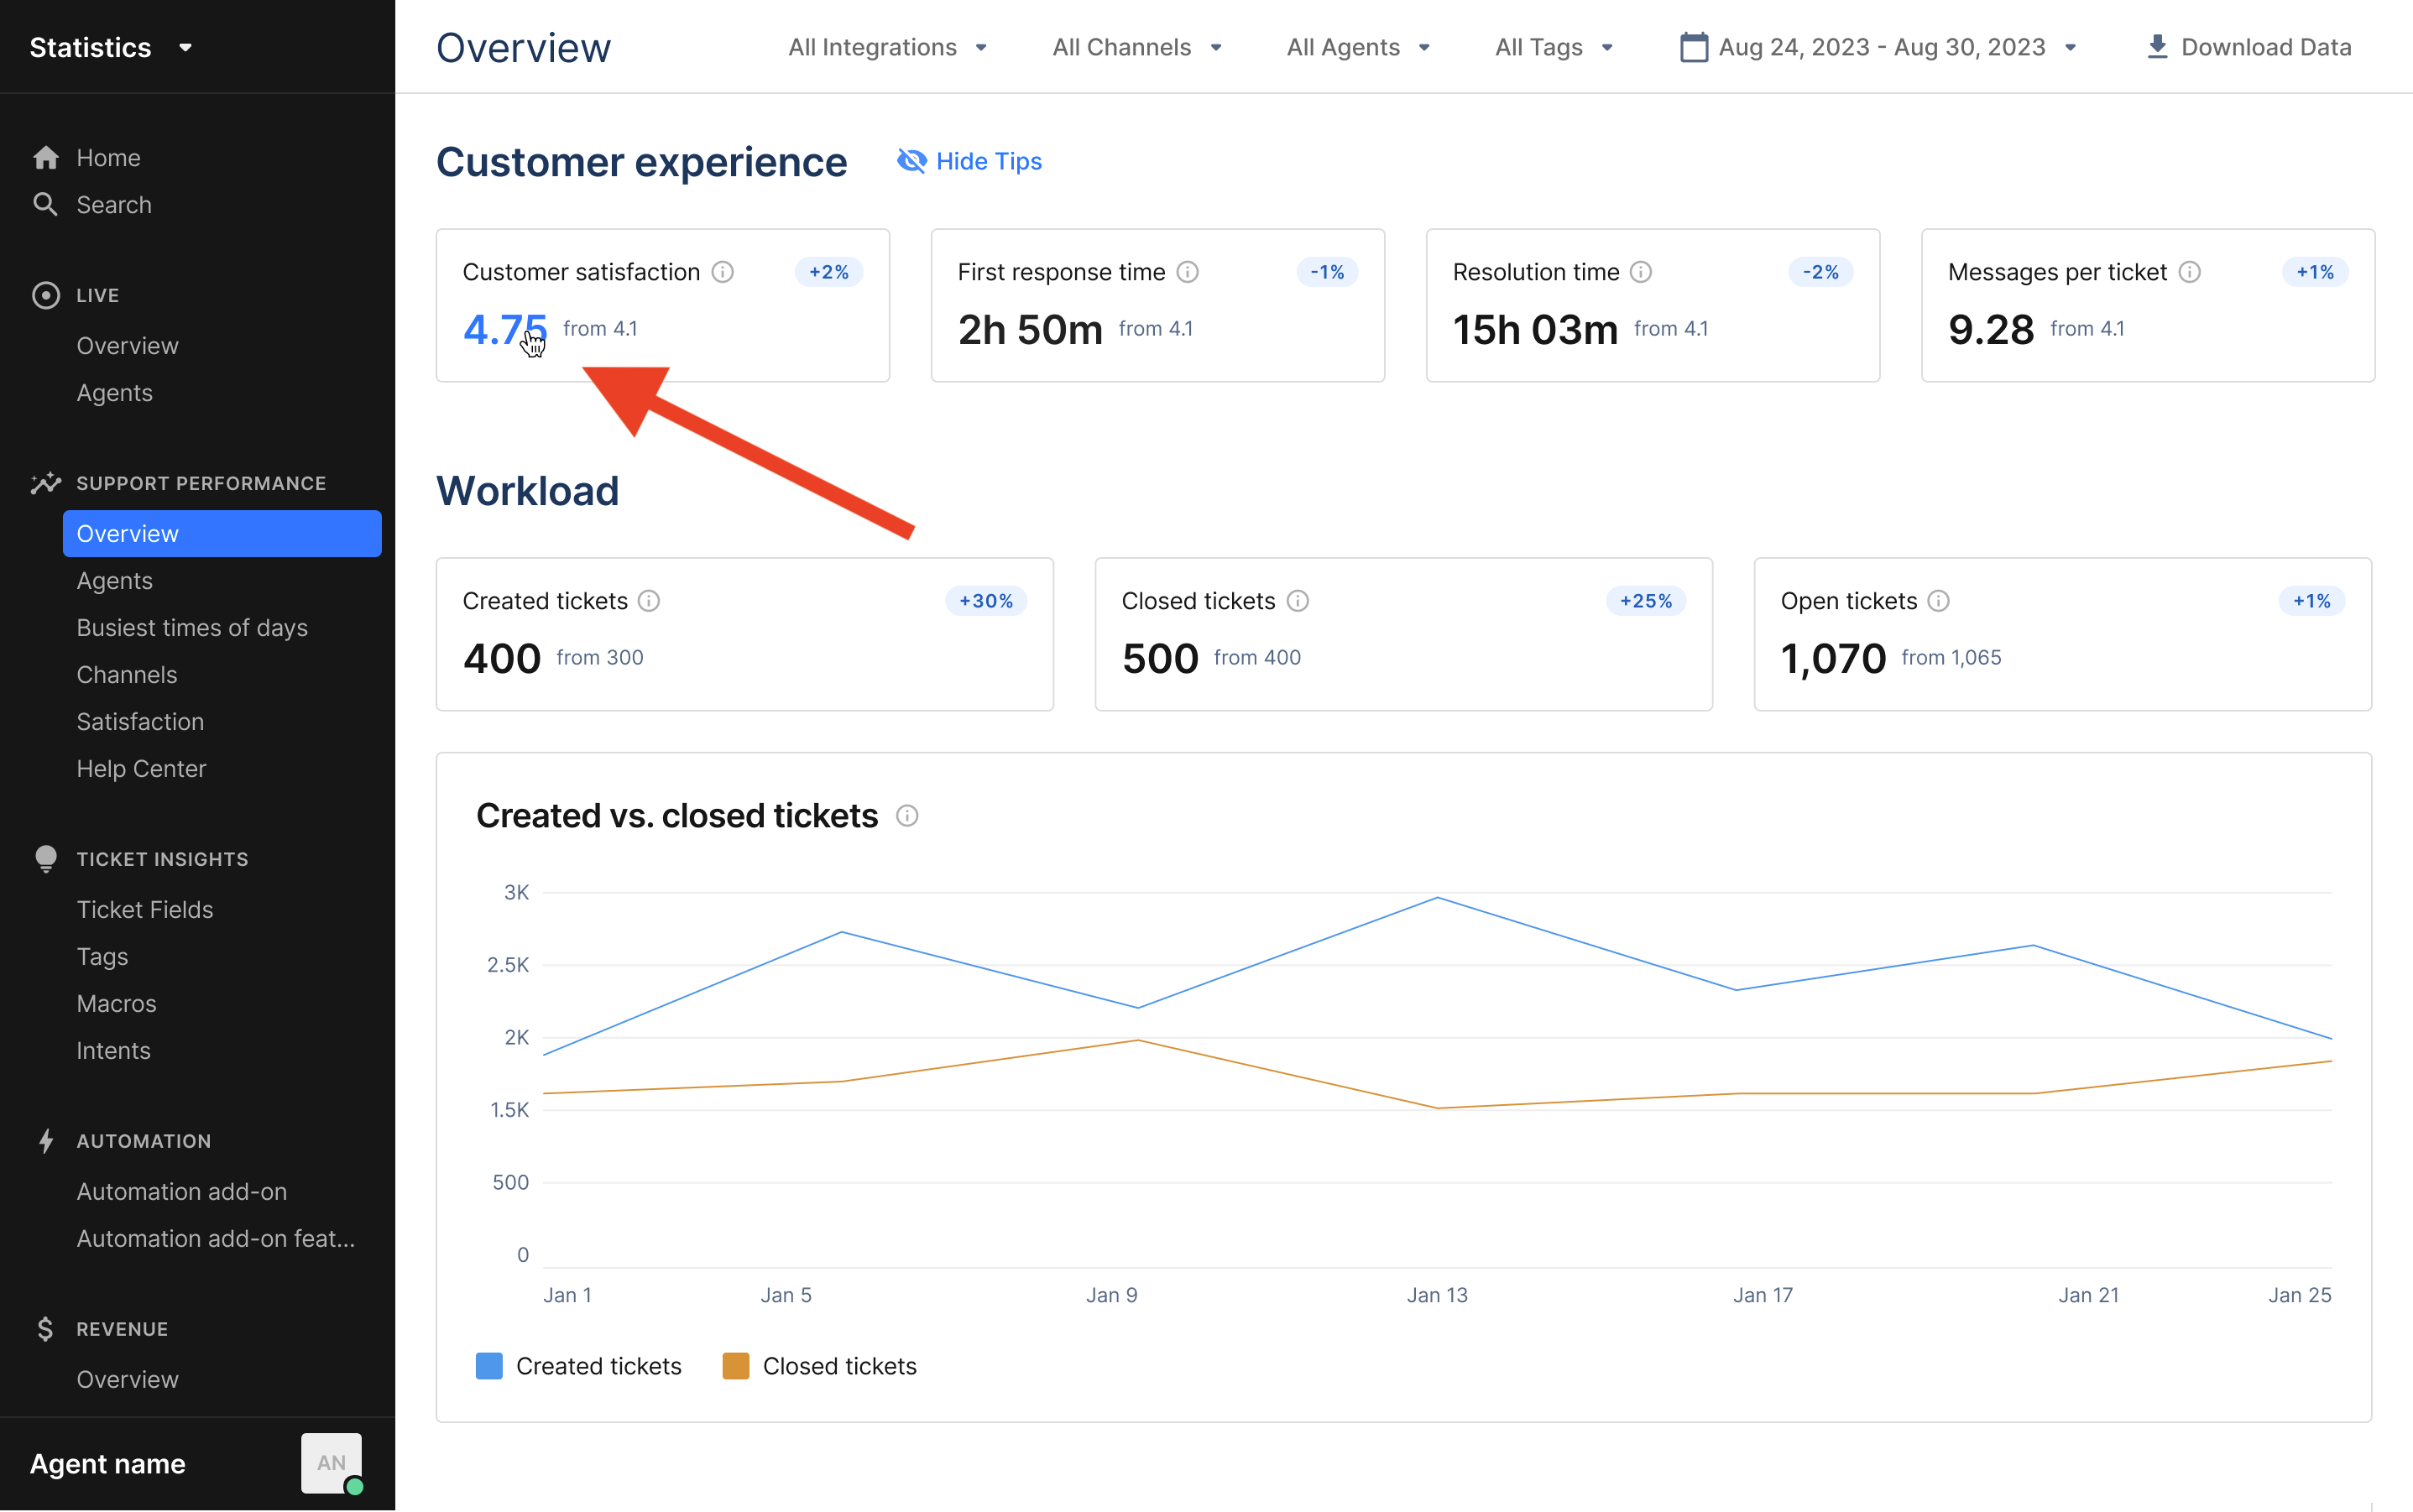
The drill-down feature is available for all metrics in the Support Performance Overview. The numbers will turn blue on hover.

How it works
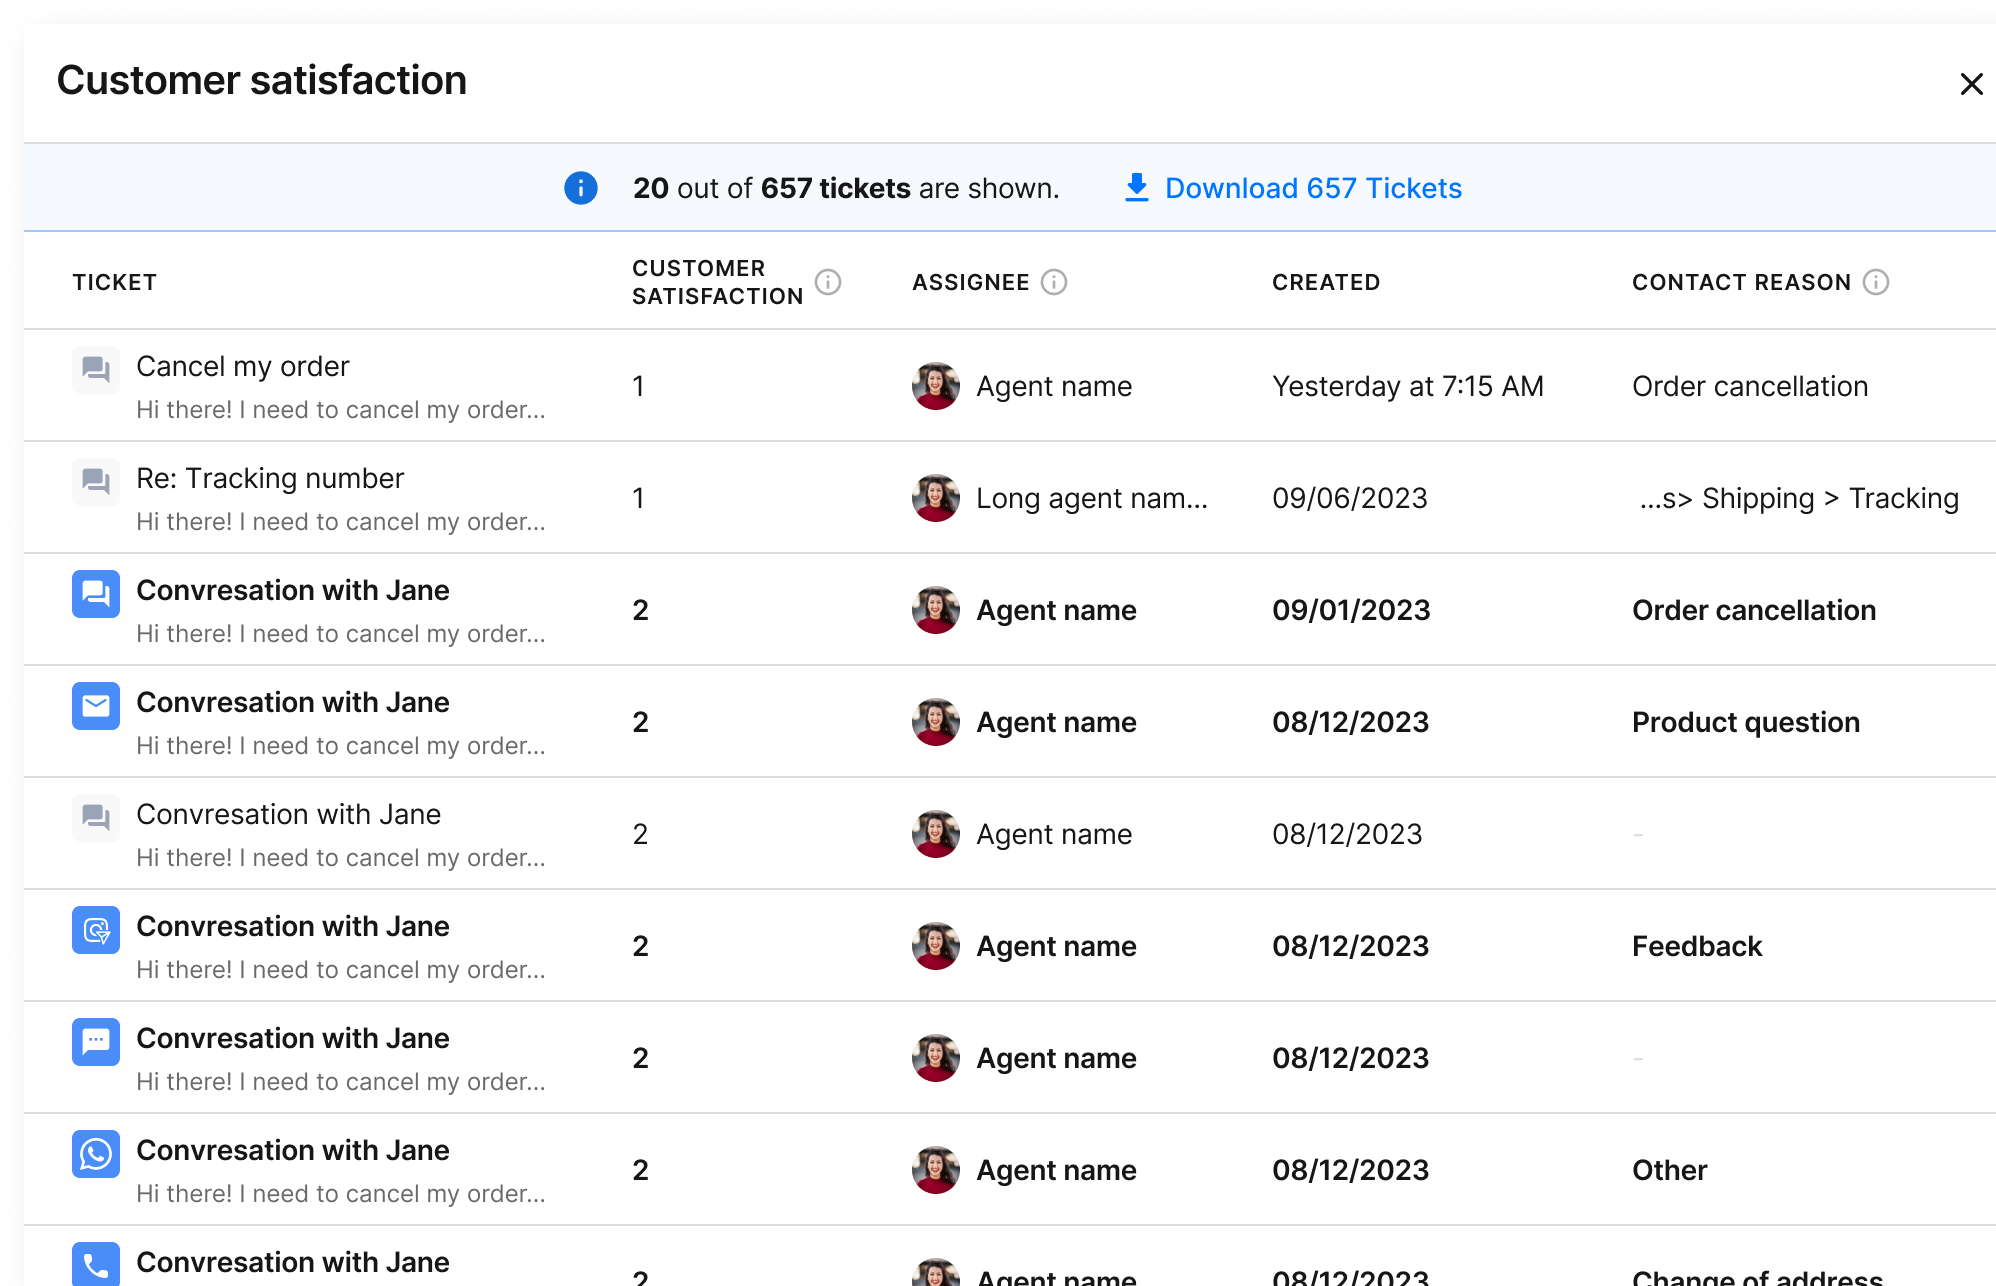
When you click on a number, you will see a list of tickets that have been used to compute said number. The tickets are sorted by most problematic first (e.g. lowest CSAT first, or highest First Response Time first) to help you spot the issue at a glance.
For each ticket, the metric value is the one at the end of the period you have selected, while all other values (Assignee user, Contact Reason) are the current ones that you see in the views. As such, for some metrics that can increase over time (e.g. Resolution Time) their current value might be different from the one listed here.

Downloading tickets
Should you need more details about the tickets to run further analyses, you can download all the tickets via CSV to crunch data further using your favorite data analytics tool.
Available columns will be:
- Ticket id
- Tags
- Initial channel
- Last used integration name
- Last used integration type
- Created by an agent
- Subject
- Creation date
- Closed date
- Survey replied date
- Assignee name
- Assignee email
- Customer email
- Customer name
- Customer last Shopify order
- Ticket fields
- Survey score
- Resolution time
- Number of agent messages
- Number of customer messages
- First response time
Please note that if you export the data for a given metric, you might not be able to use this data to compute a different metric and see the number displayed in the report because the 2 metrics might rely on different tickets. For instance, FRT relies on tickets where the 1st agent response happened during the period, whereas RT relies on tickets where the last close happened during the period.