
How Metrics are CalculatedUpdated 18 days ago
This is a breakdown of the various metrics talked about in our statistics - what they are and how they're calculated.
Sign up for our Masterclass on Statistics
We often mention the median - while the average is the sum of all values divided by the number of values, the median is the middle value of an ordered list of values.
Customer Experience
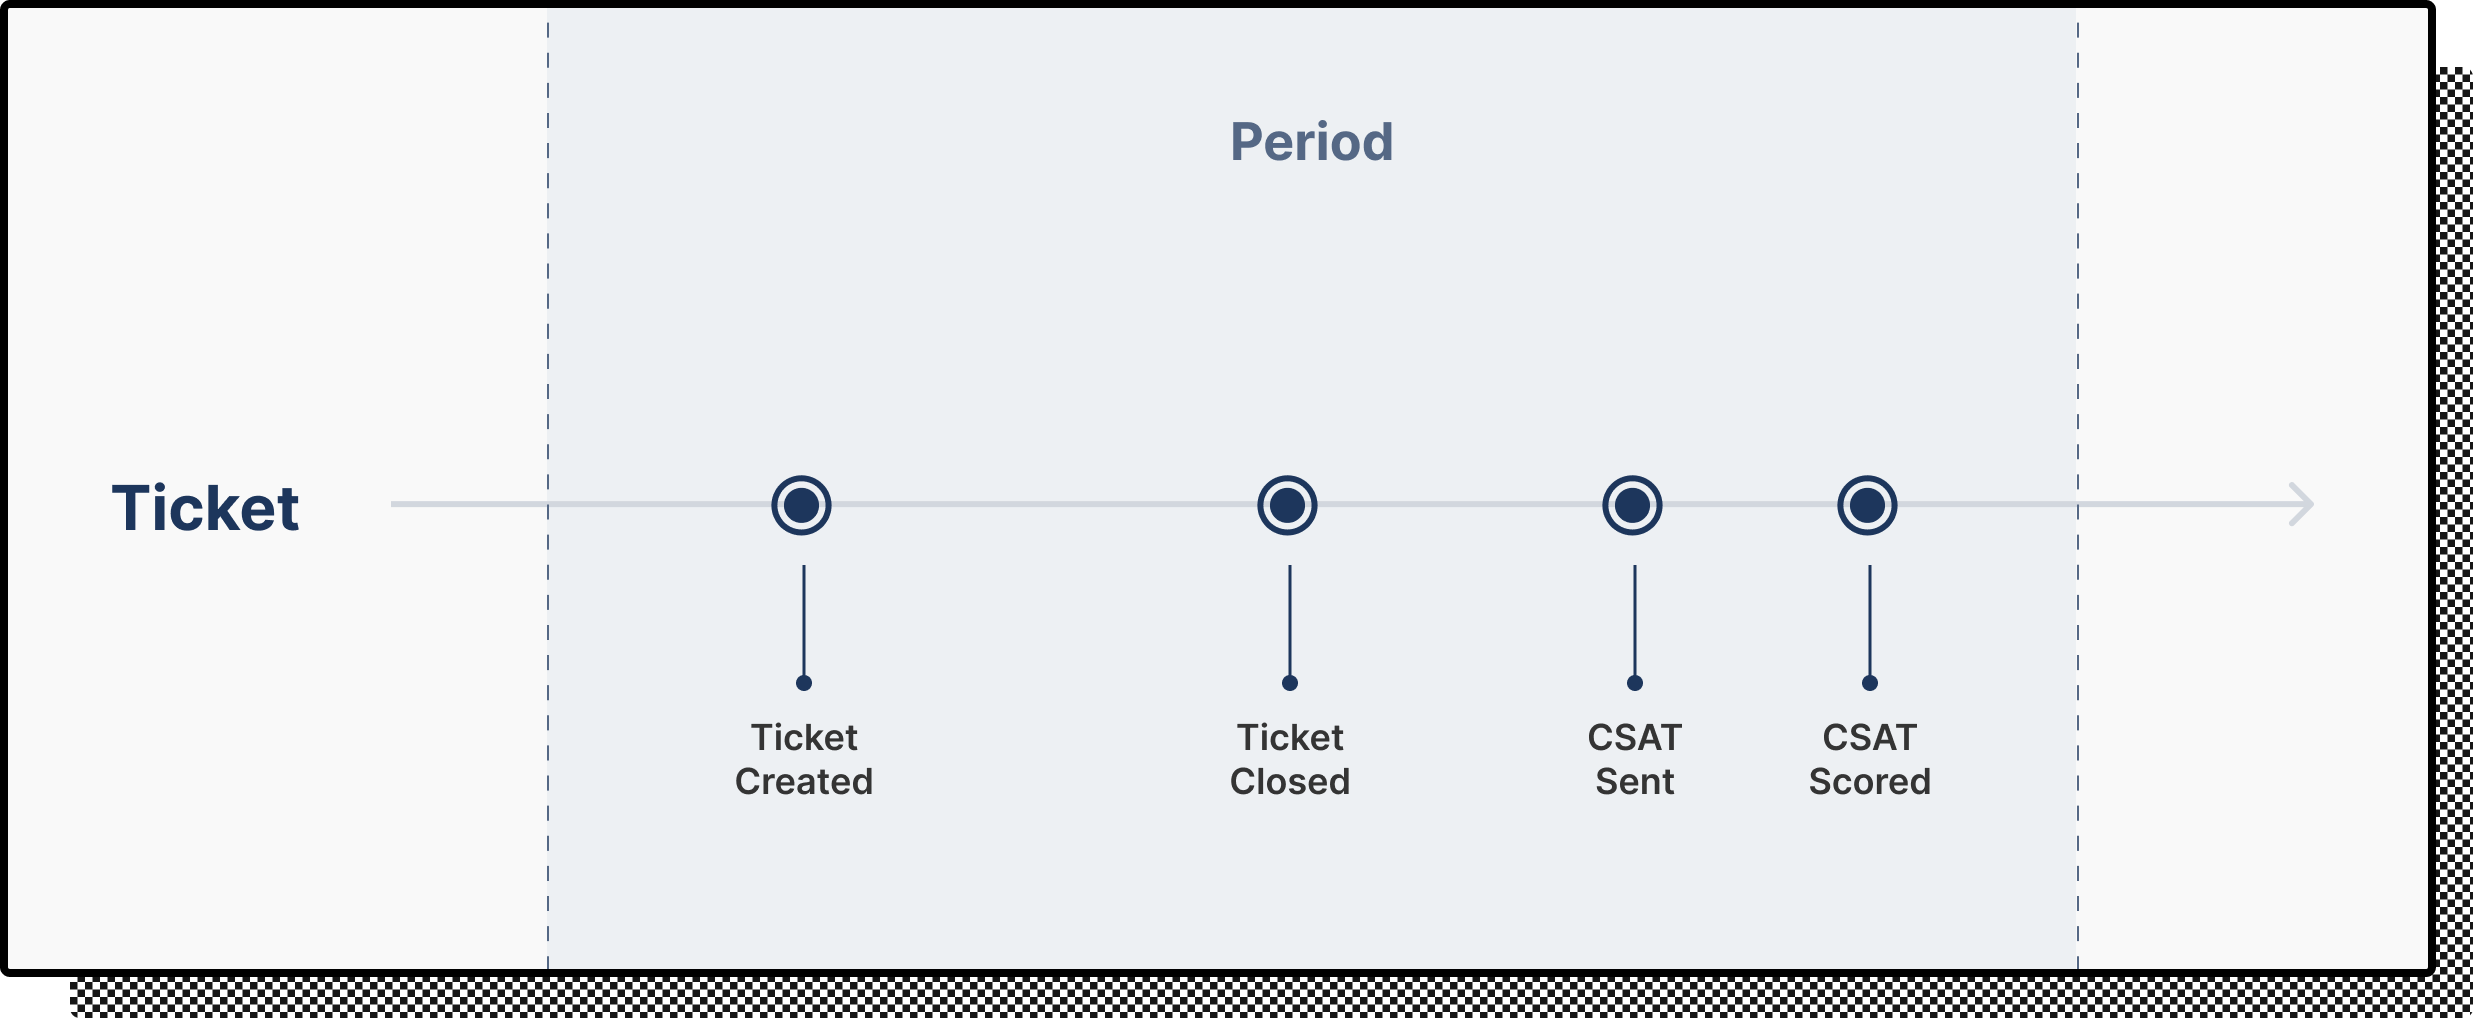
How satisfied (on a scale of 1-5) your customer is with the service your team has provided.
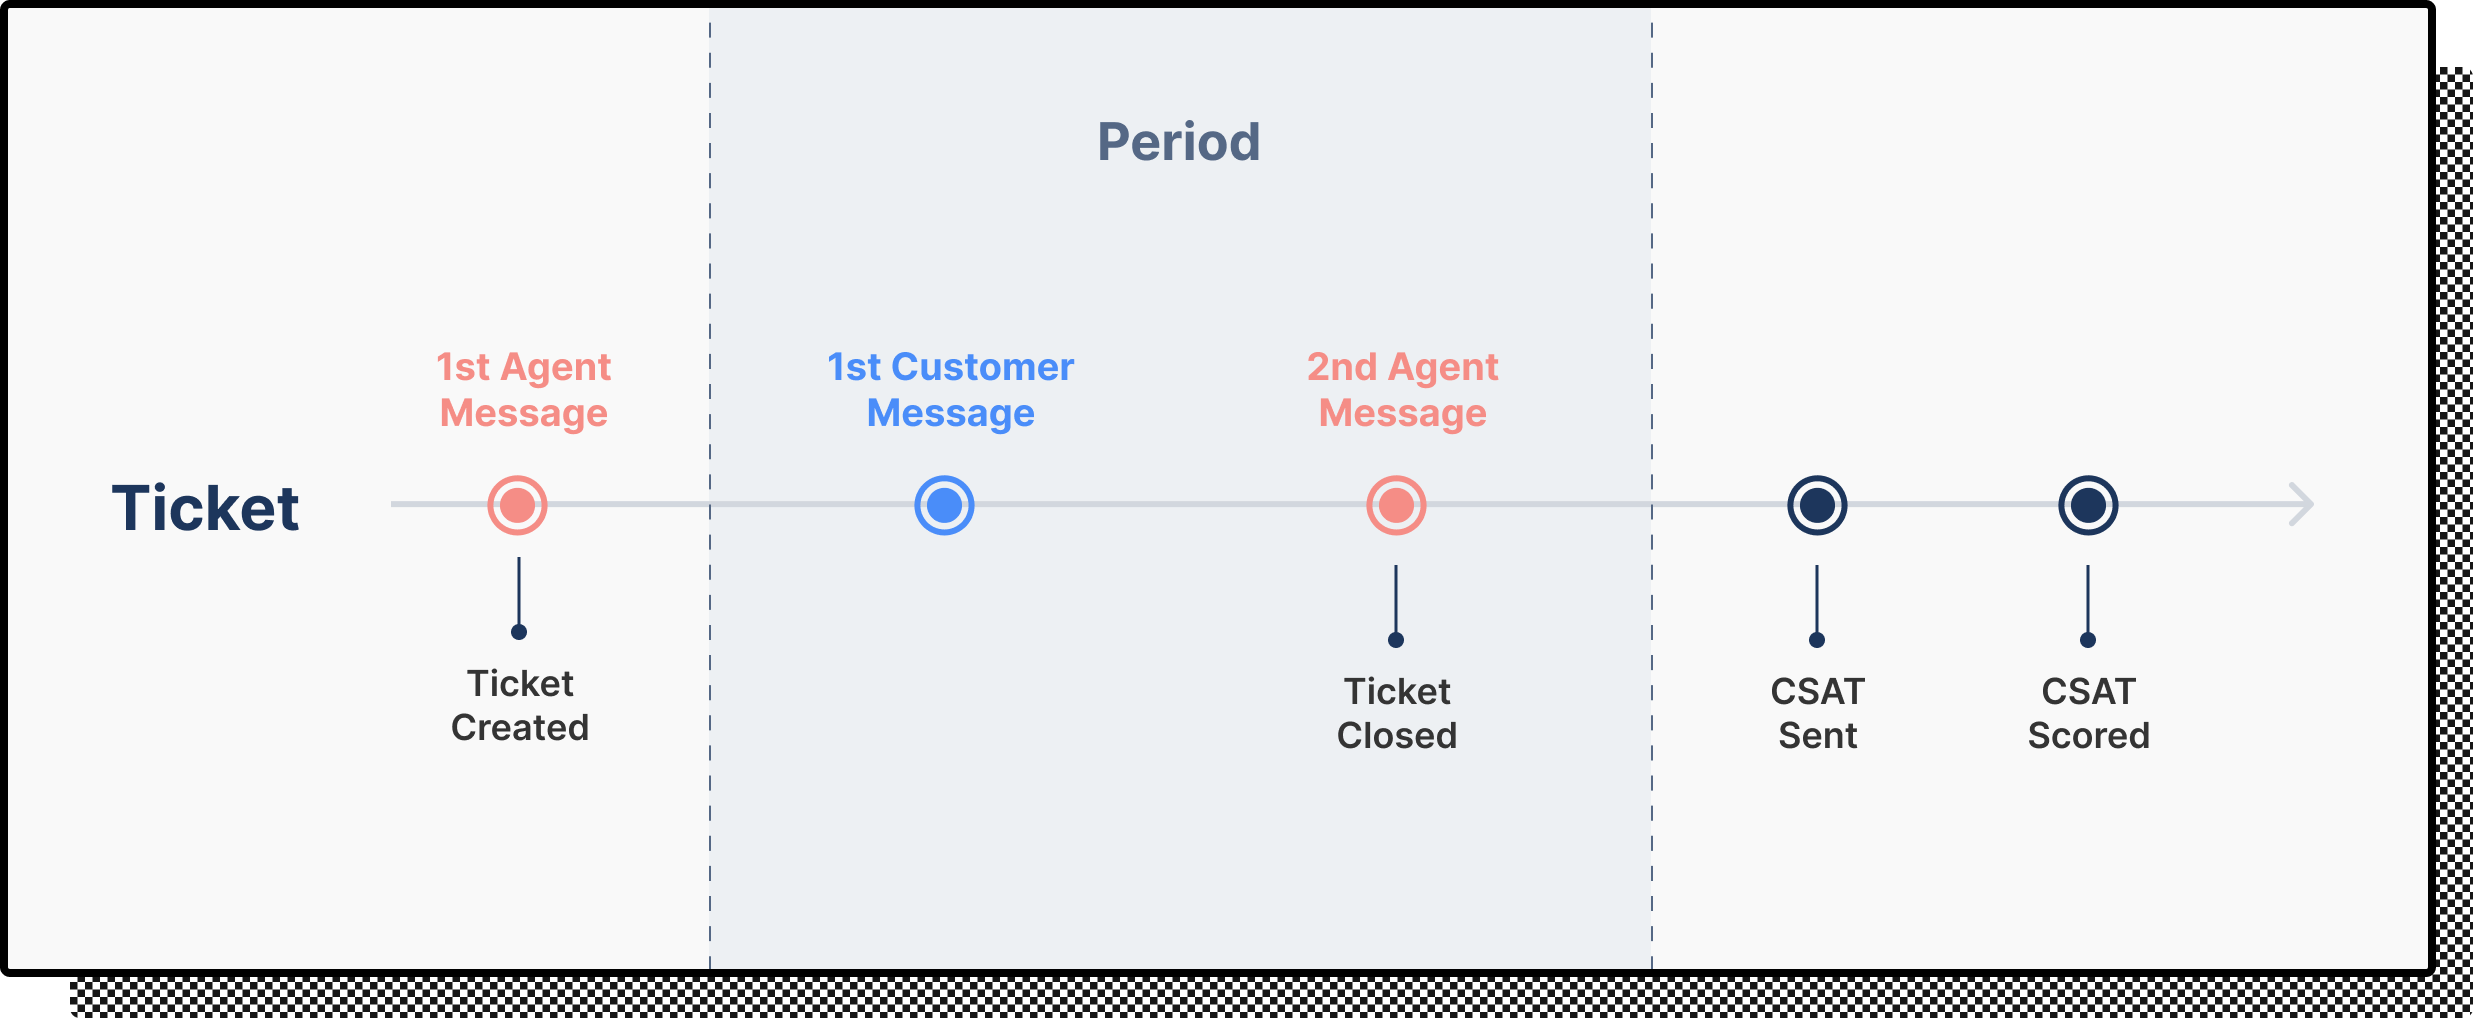
Since the CSAT occurs during the selected period, the following ticket would be included.
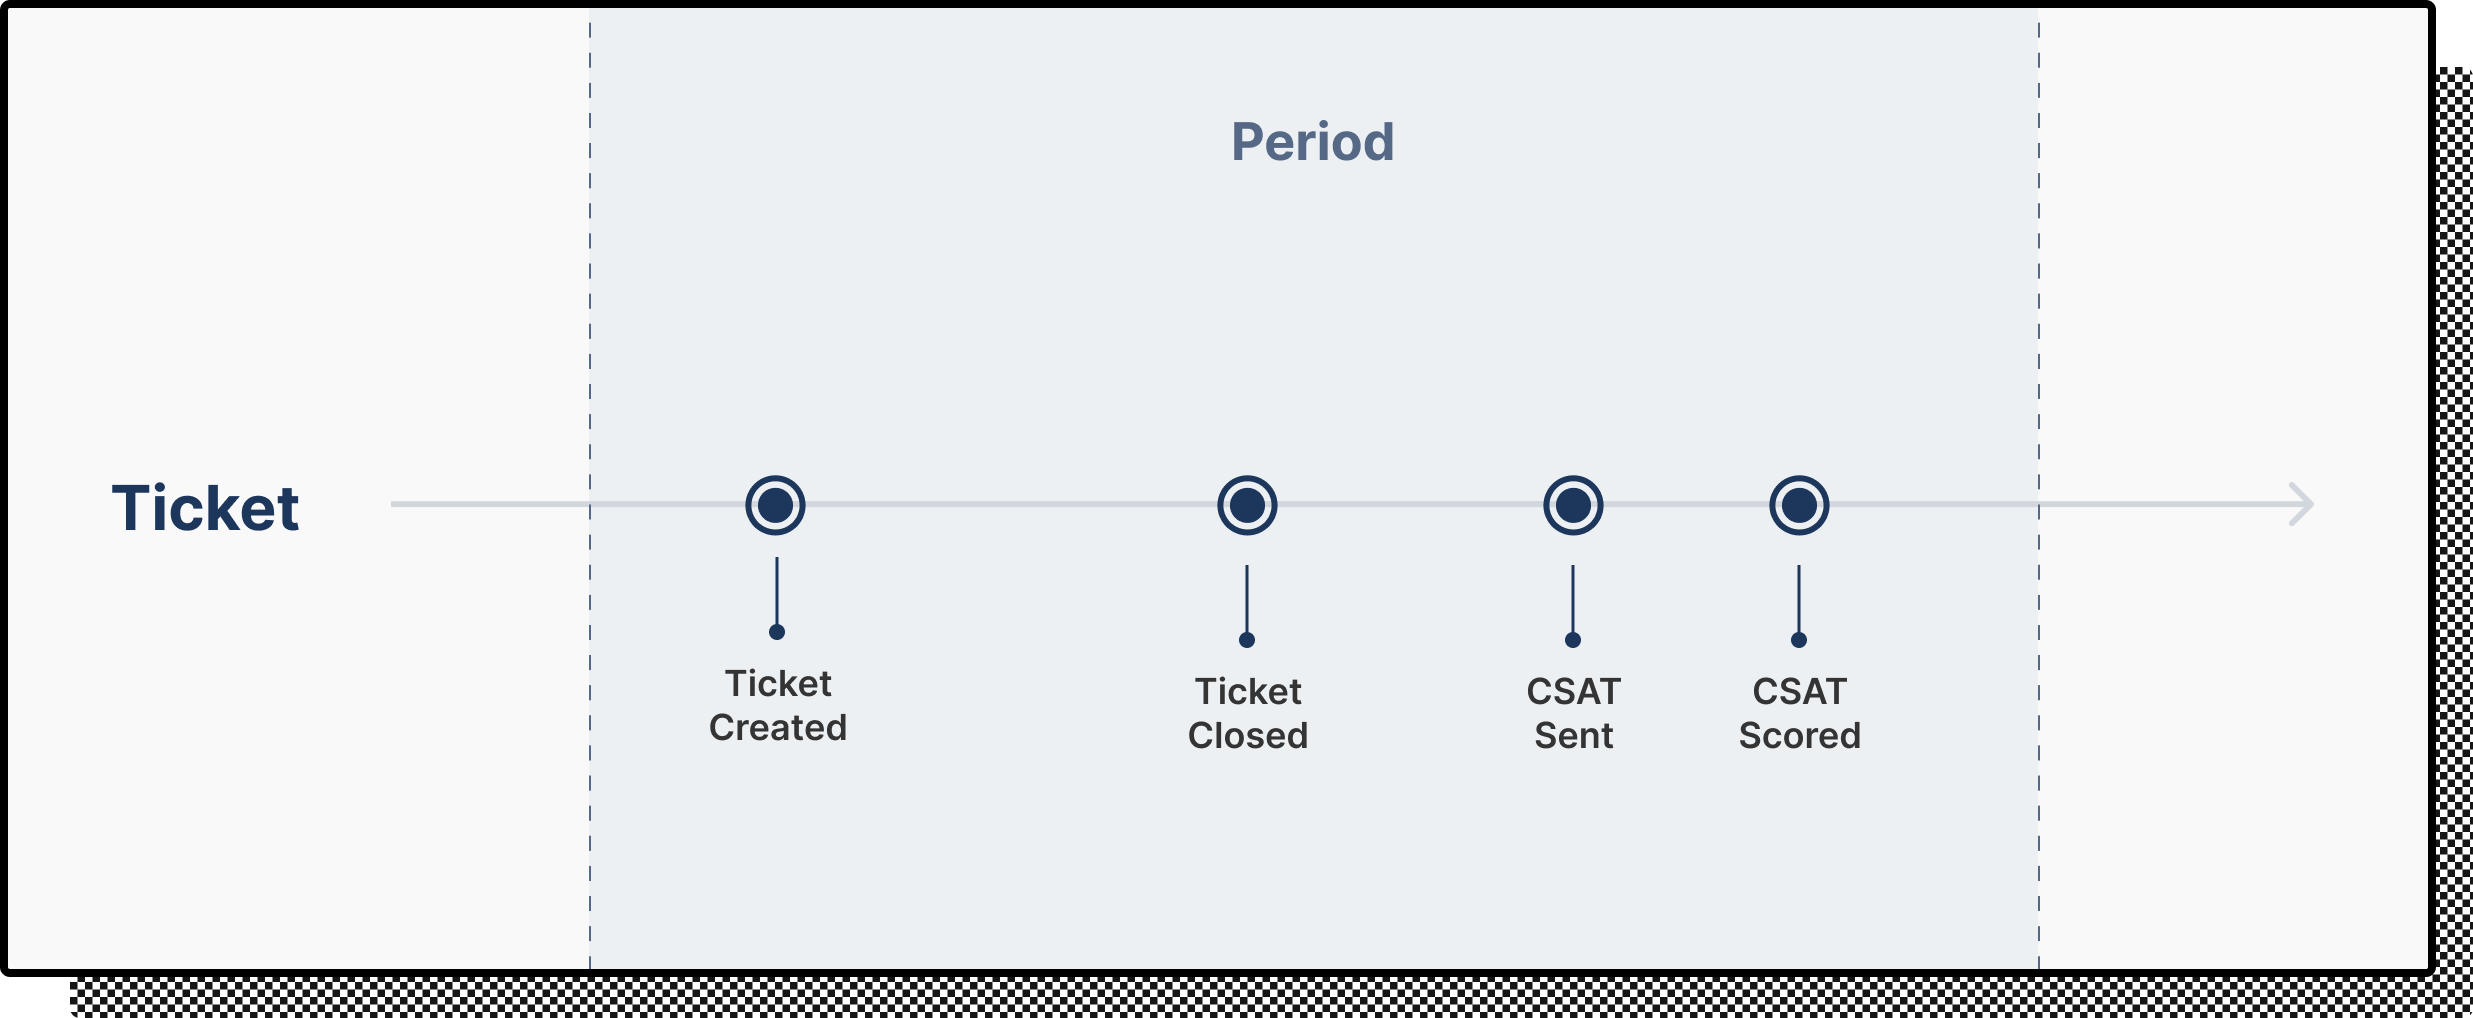
This example isn't included since the event (CSAT sent) occurred after the selected period.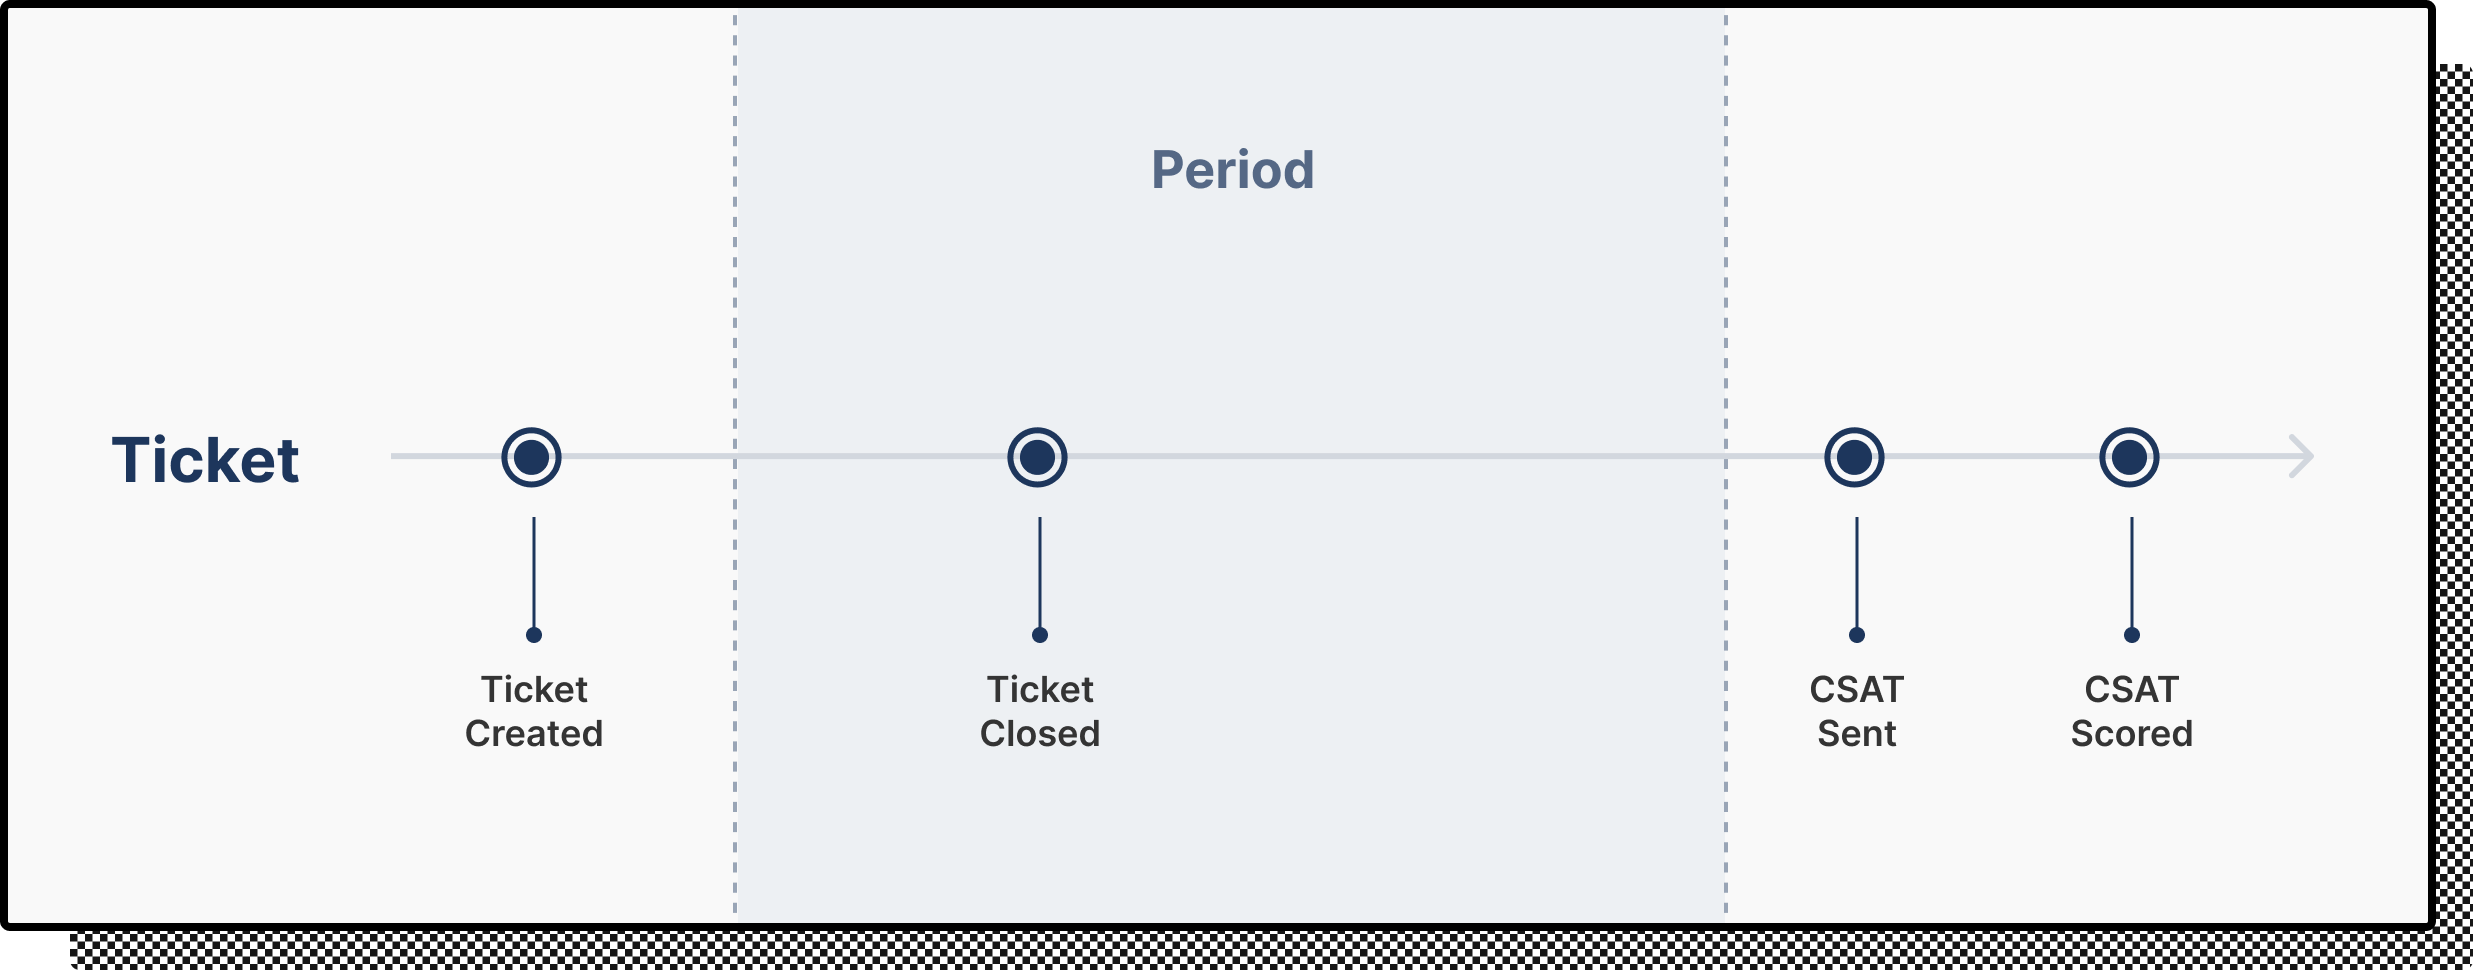
Metrics that can also be computed using the tickets presented as an example are First response time, Resolution time, Messages per ticket, Tickets replied, Messages sent, and Closed tickets.
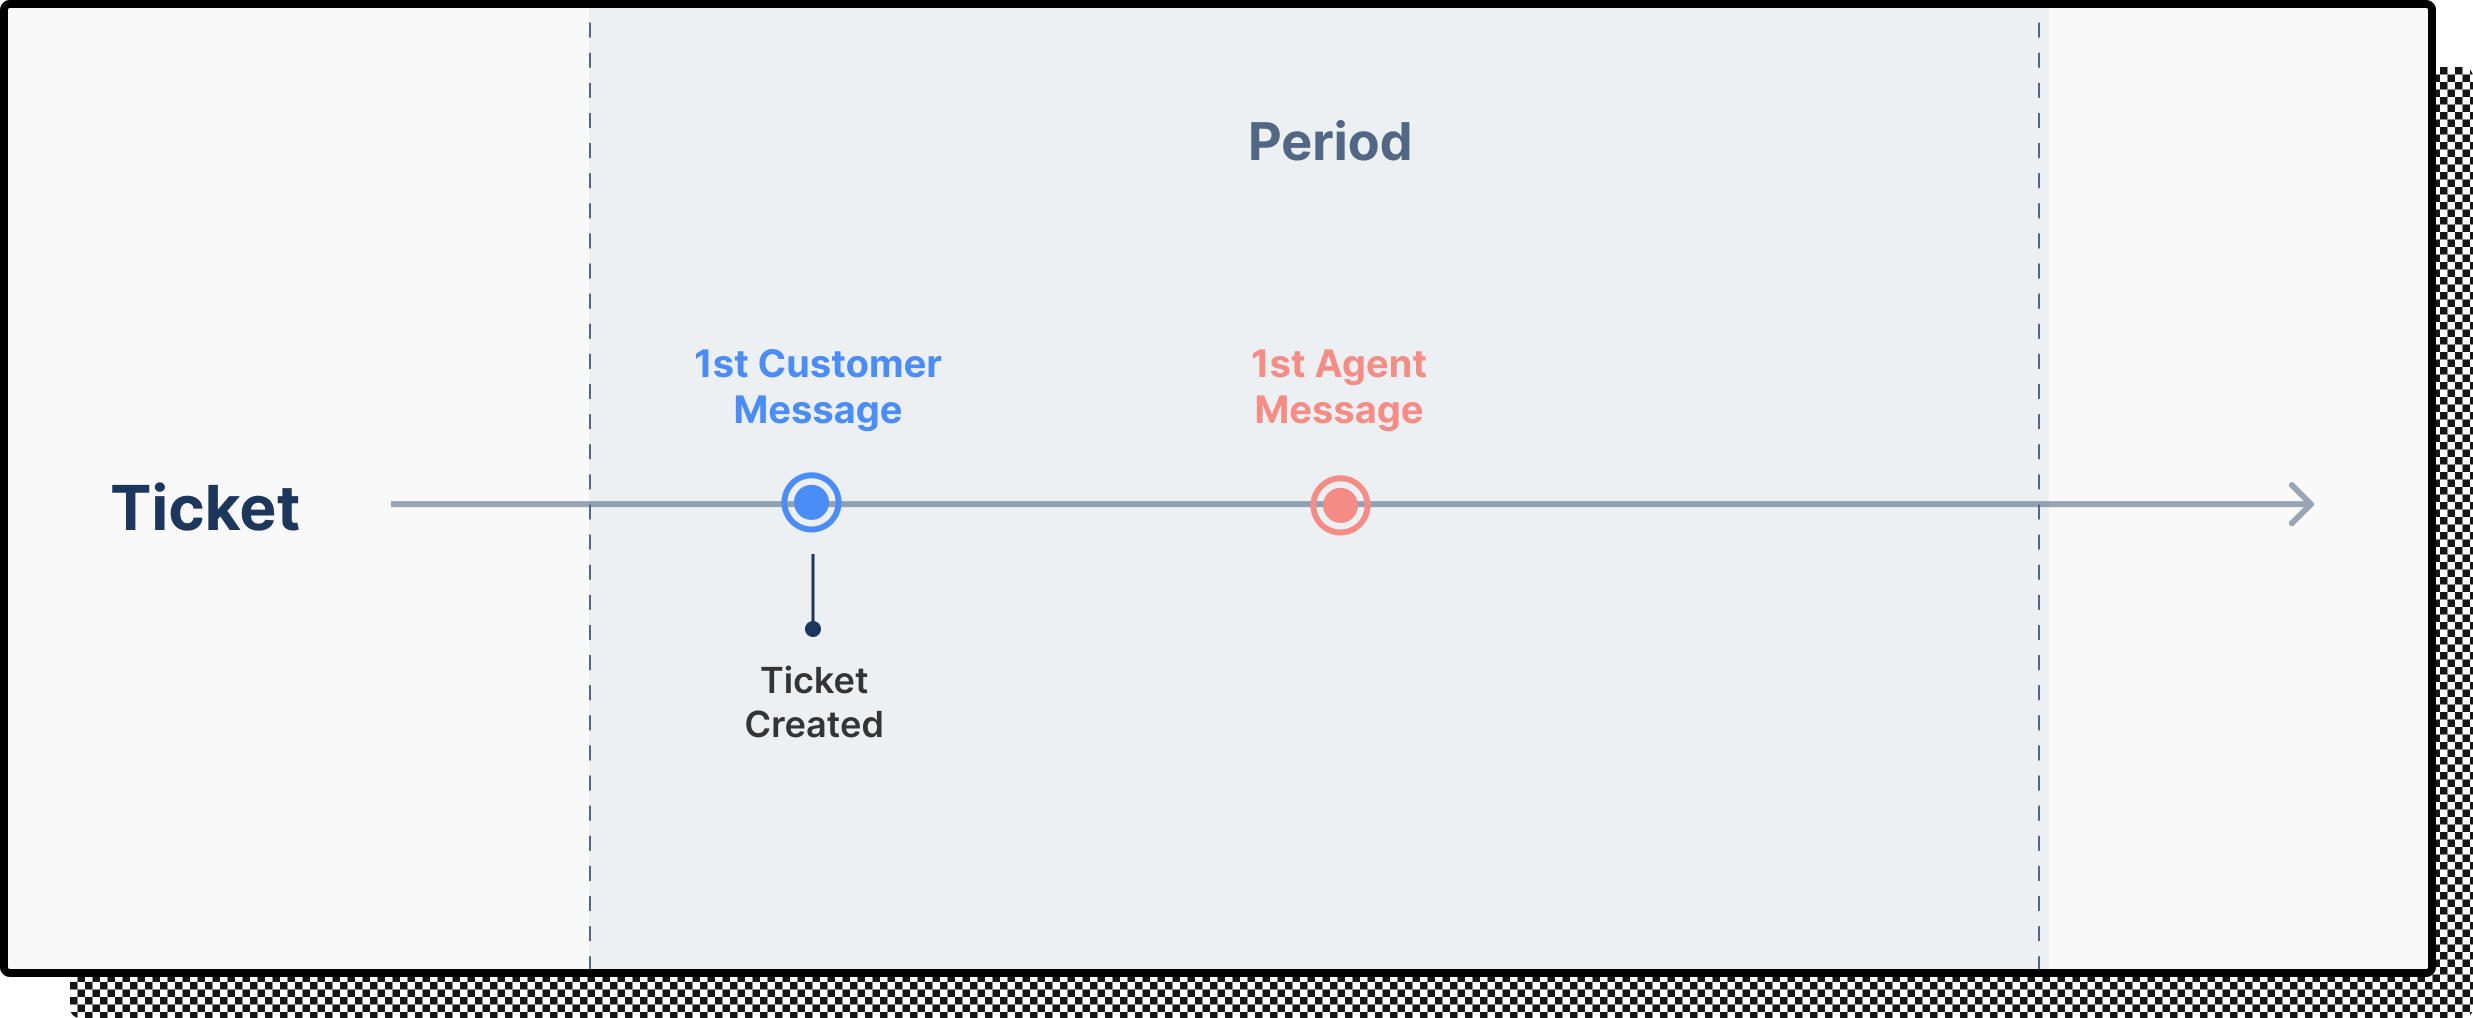
First Response Time
The time your customer has to wait to talk first to an agent. To be included, a ticket needs to have the first agent reply during the period.
Rule-generated messages, messages sent outside of the helpdesk (if the agent replies to an email thread directly in Gmail), and tickets started by an agent from the helpdesk are ignored when computing the FRT.
Since the FRT occurred during this period, this ticket will be included in the computation.
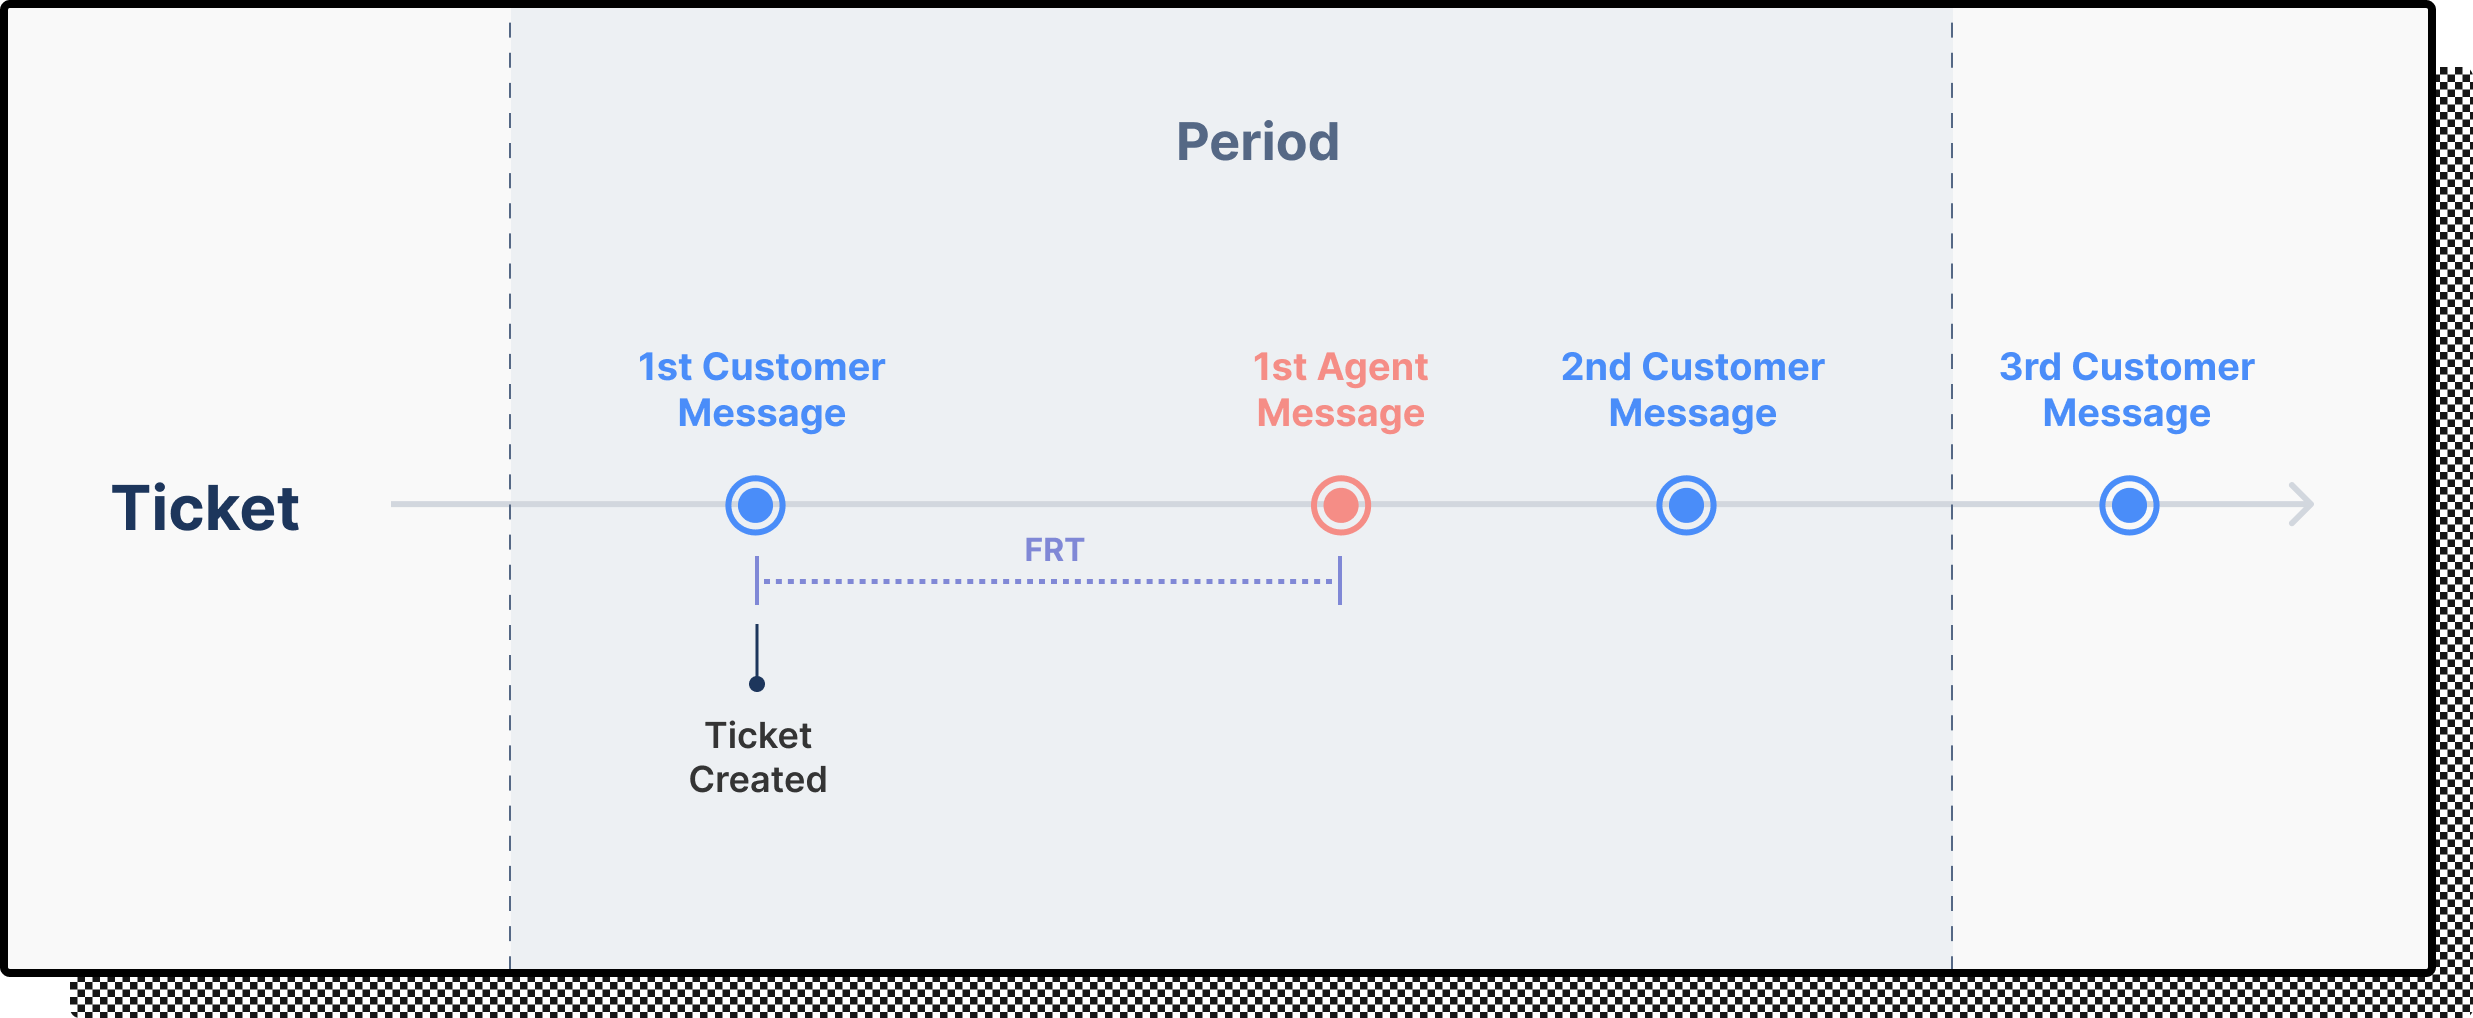
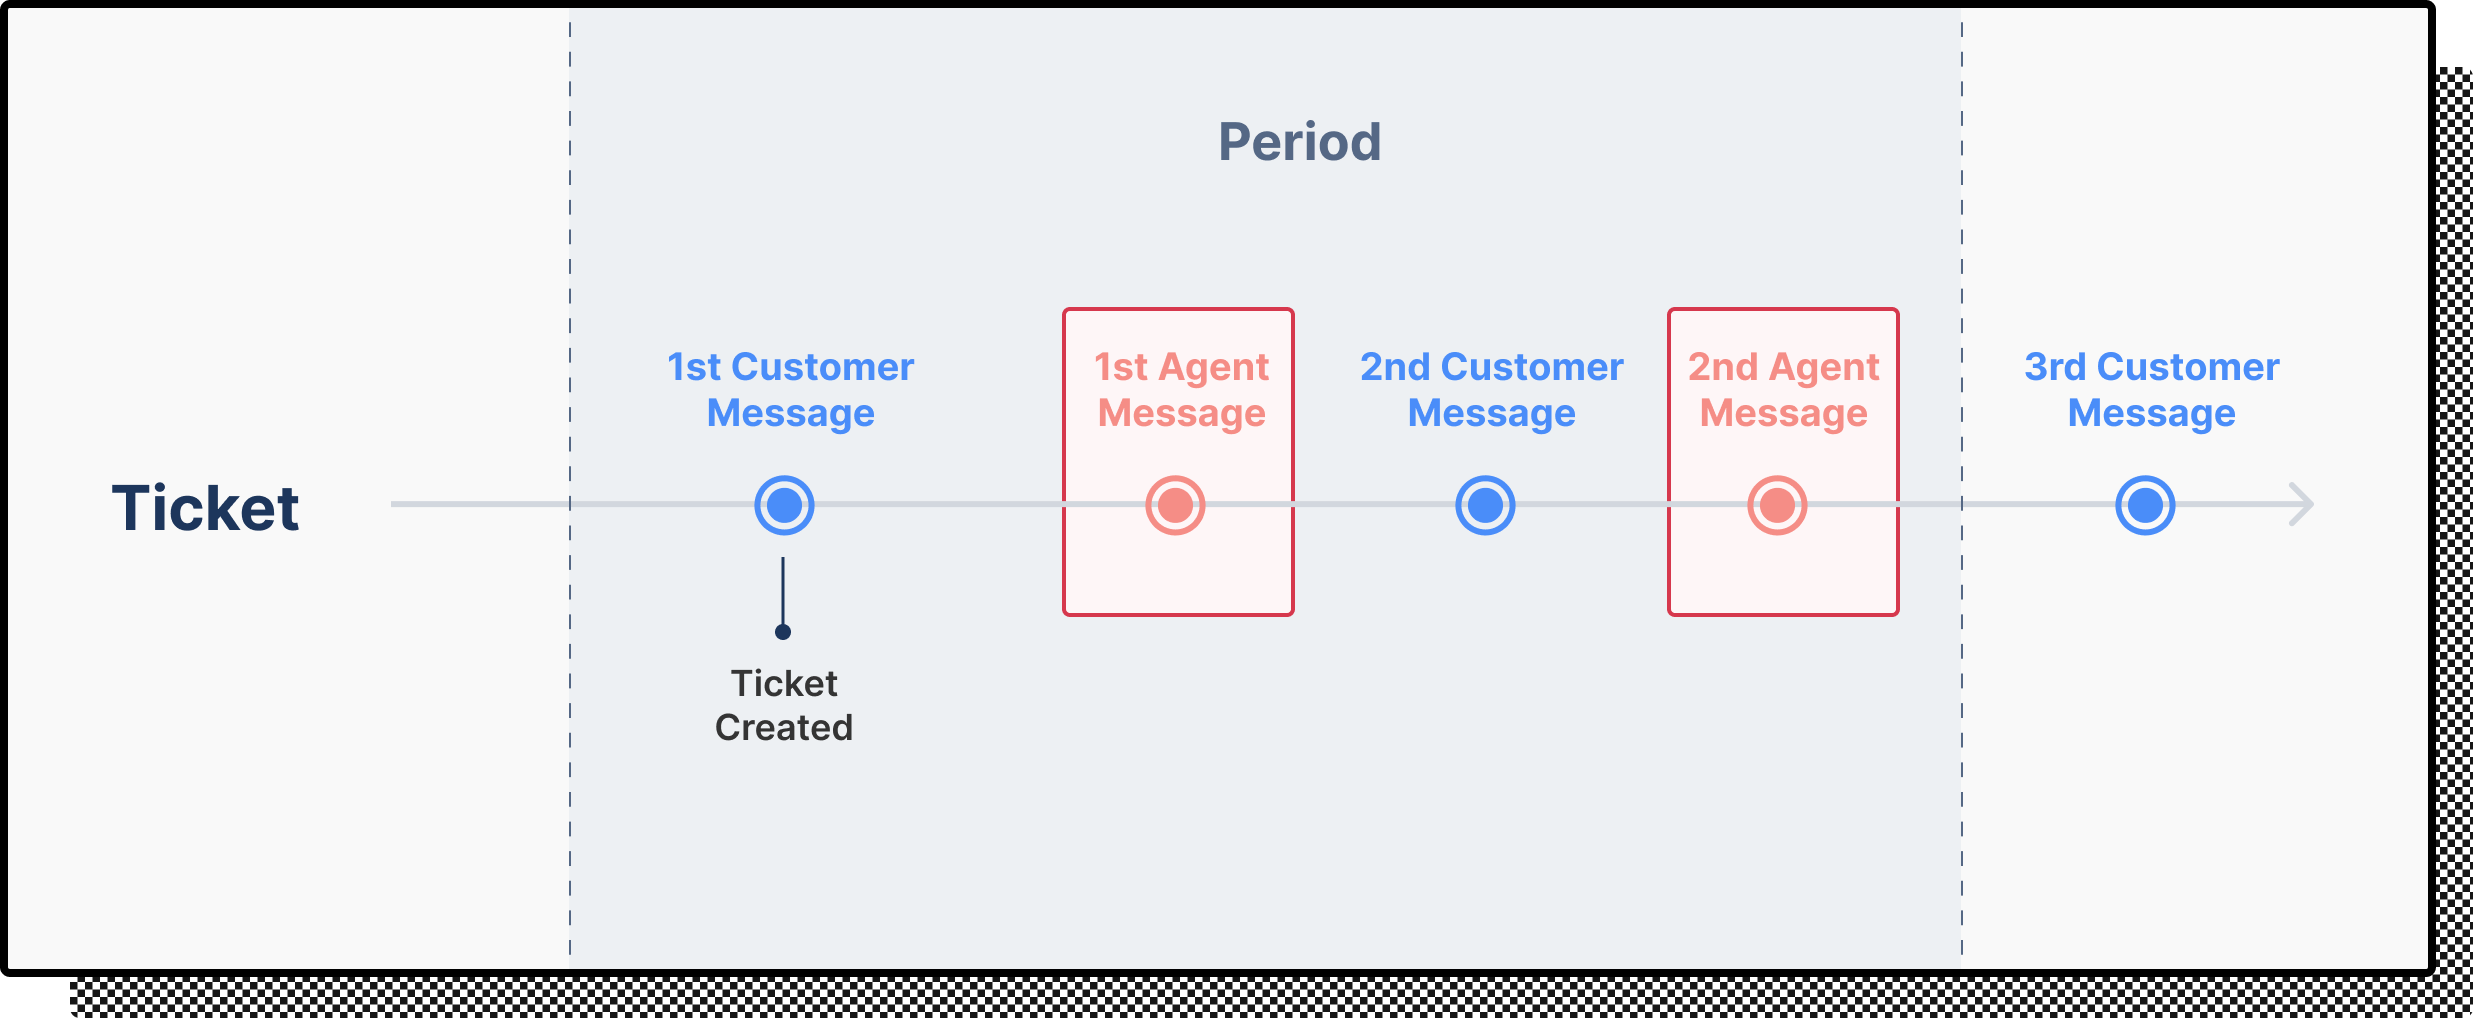
Metrics that can also be computed using the ticket presented as an example are First response time, Message per ticket, Tickets replied, and Messages sent.
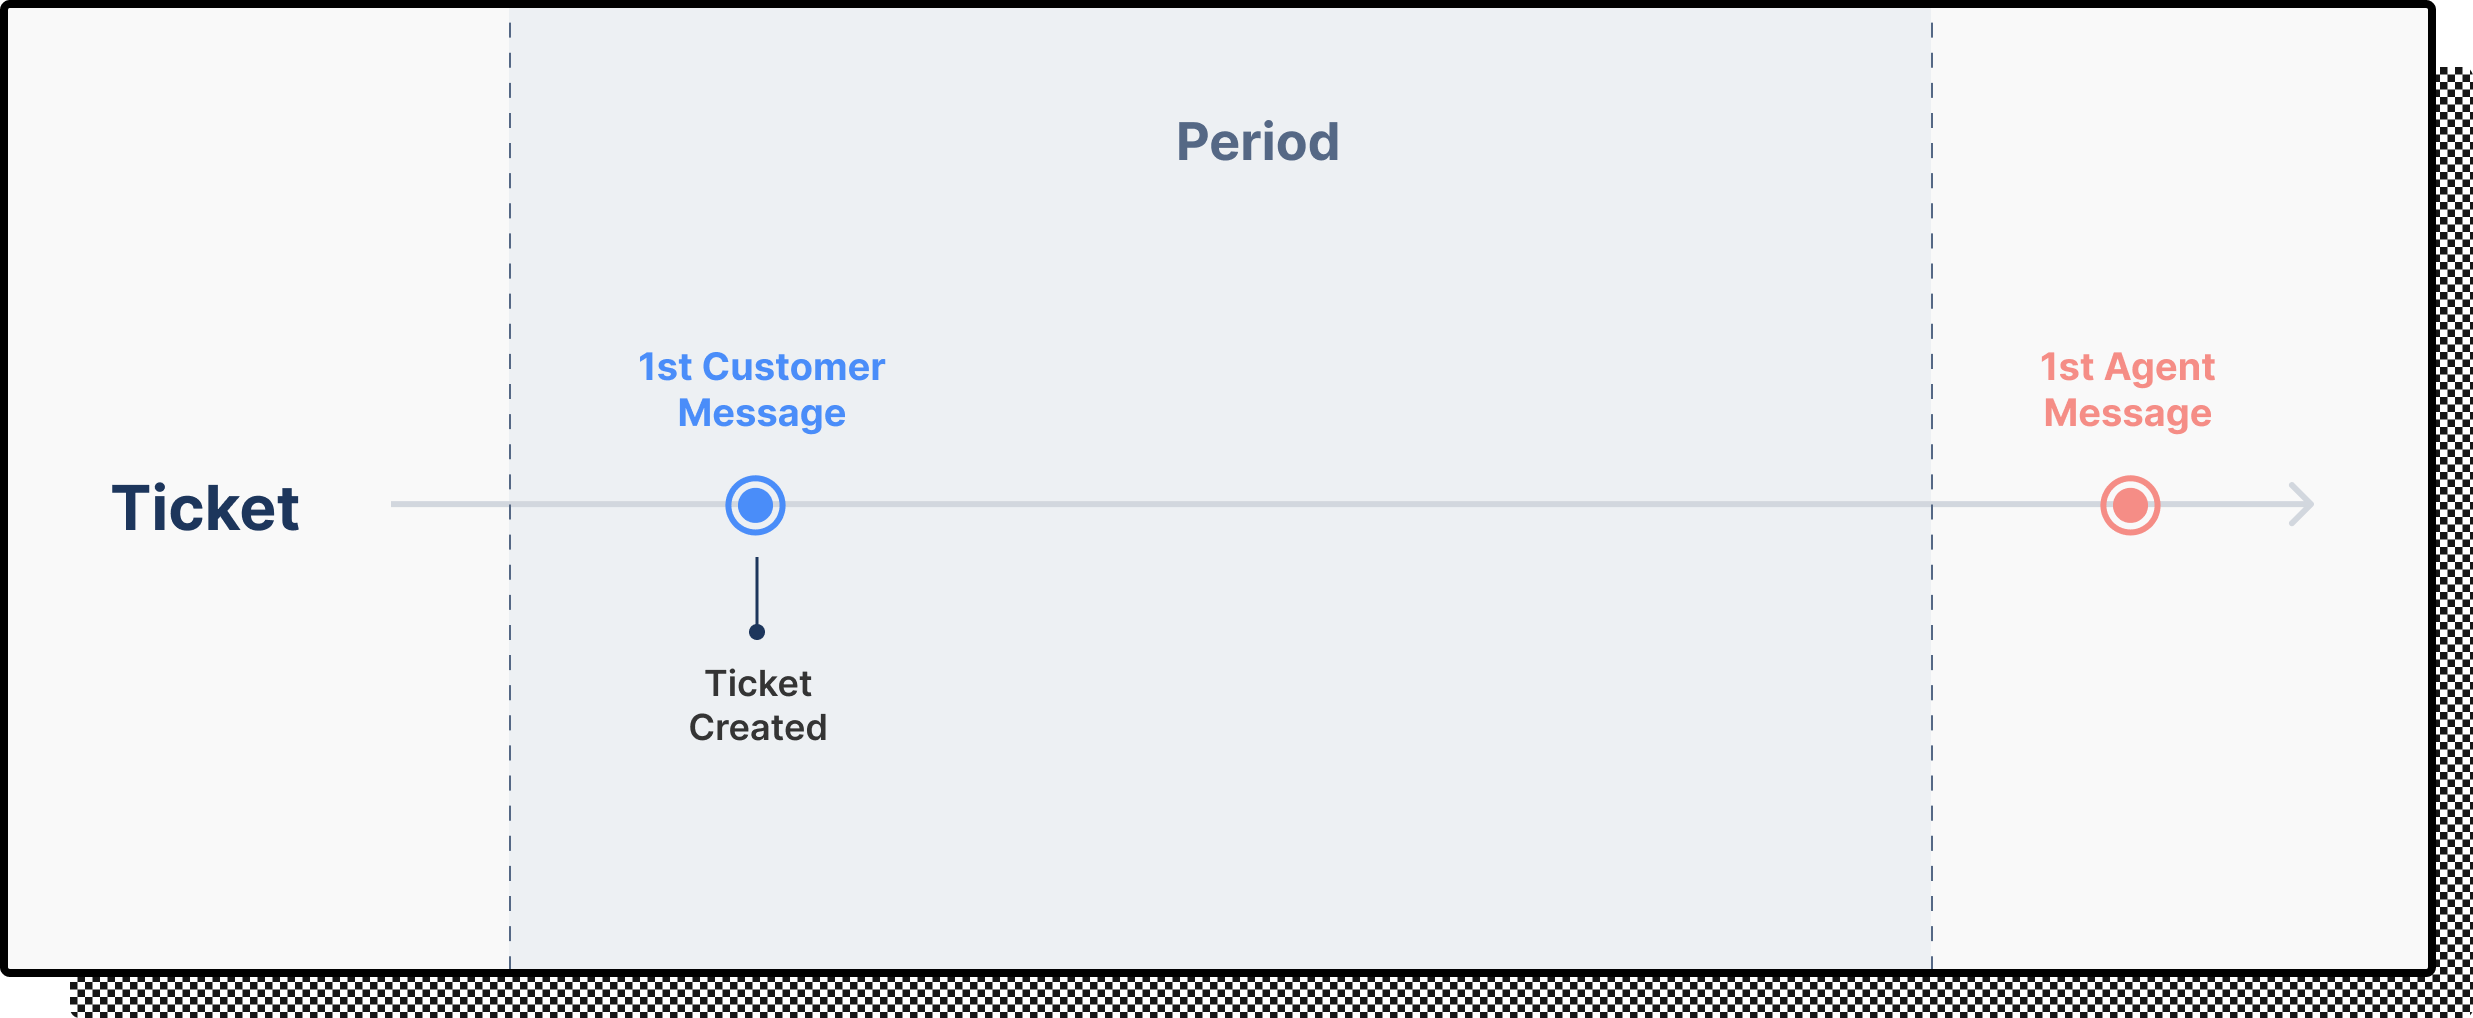
Since the first agent message occurred after the selected period, it isn't included.
Resolution time
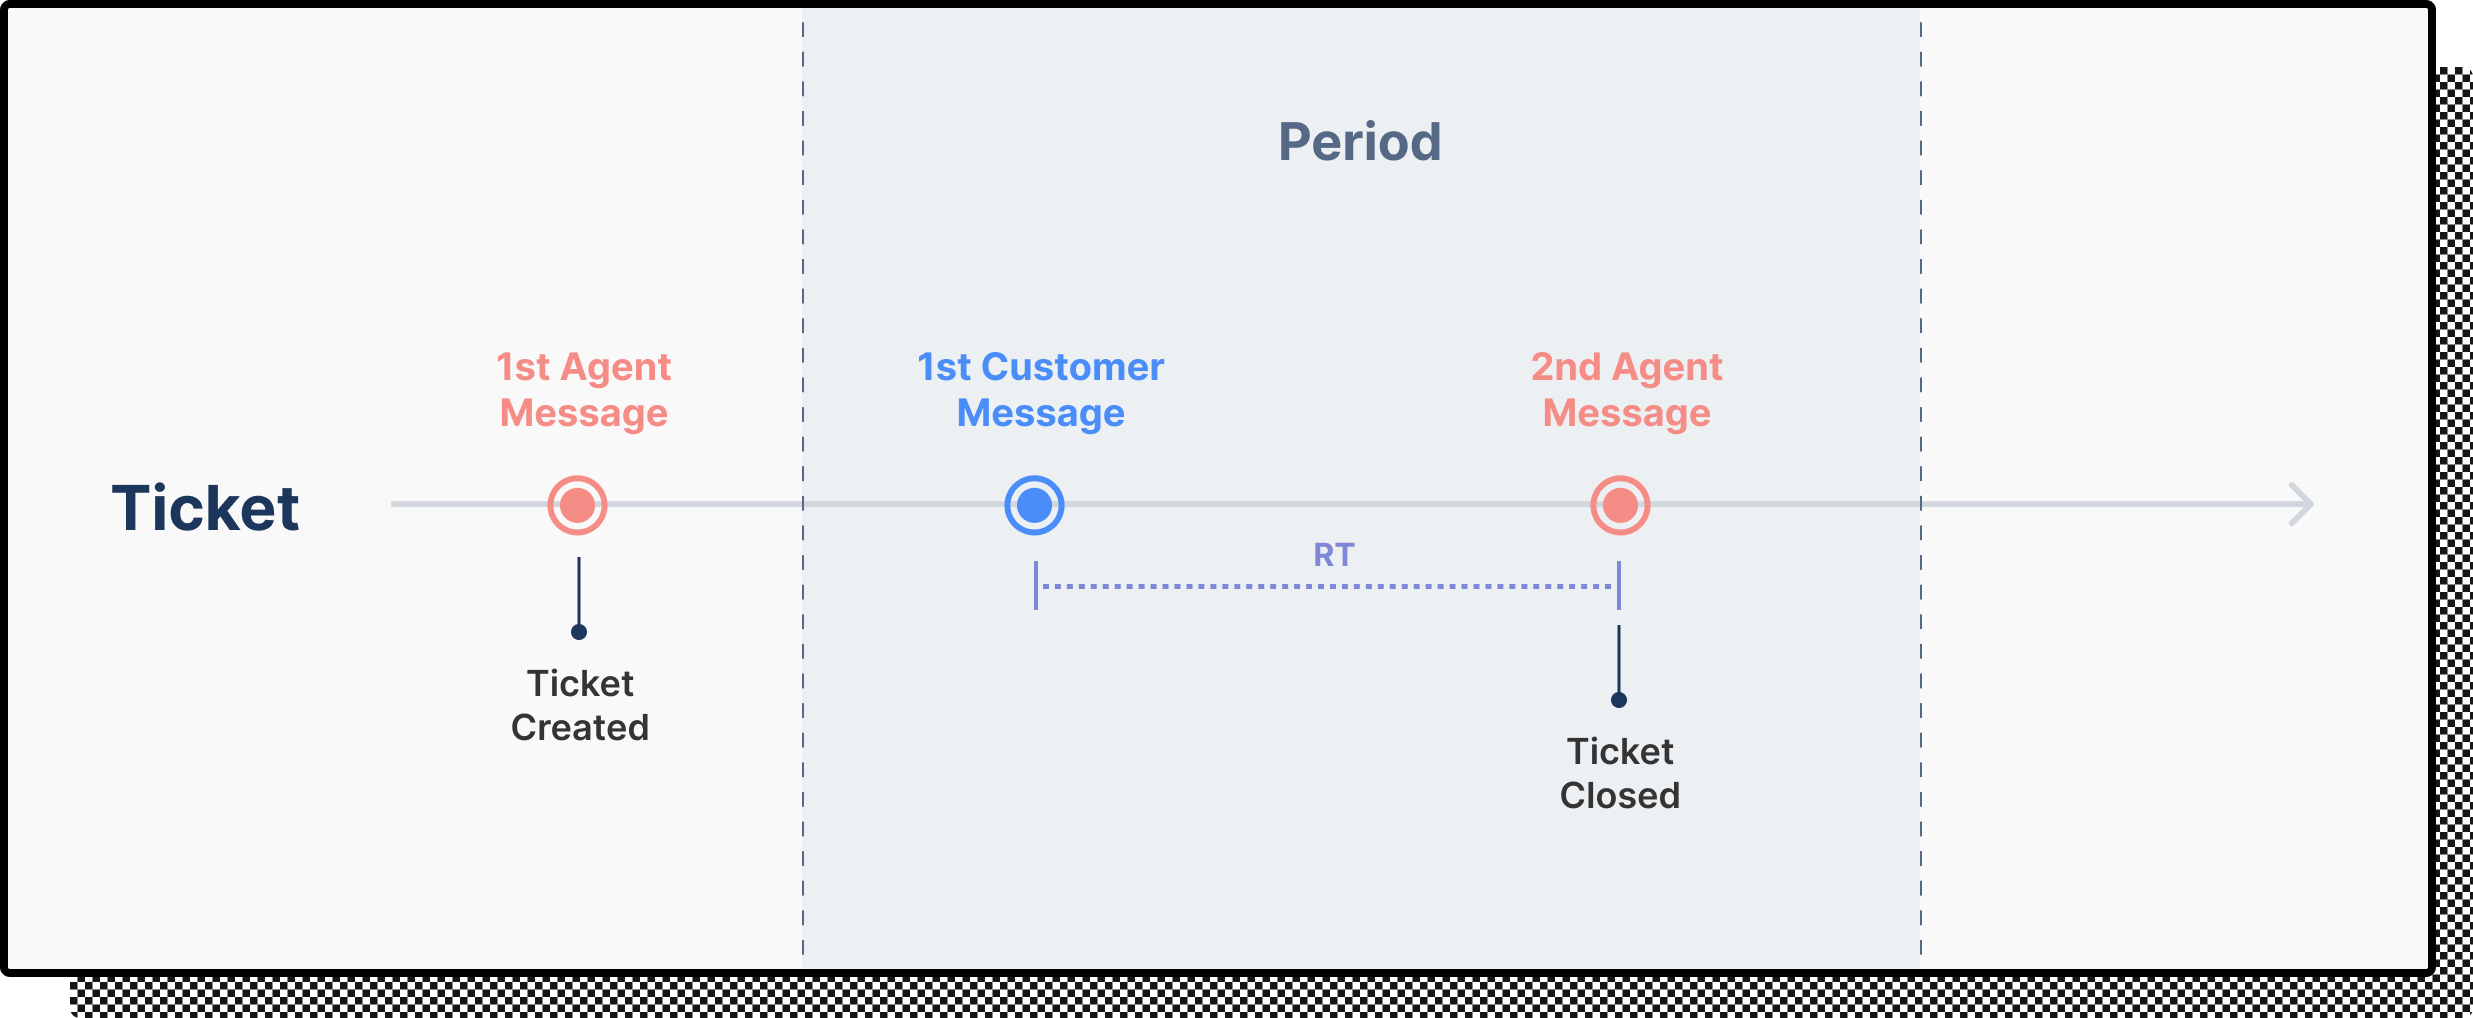
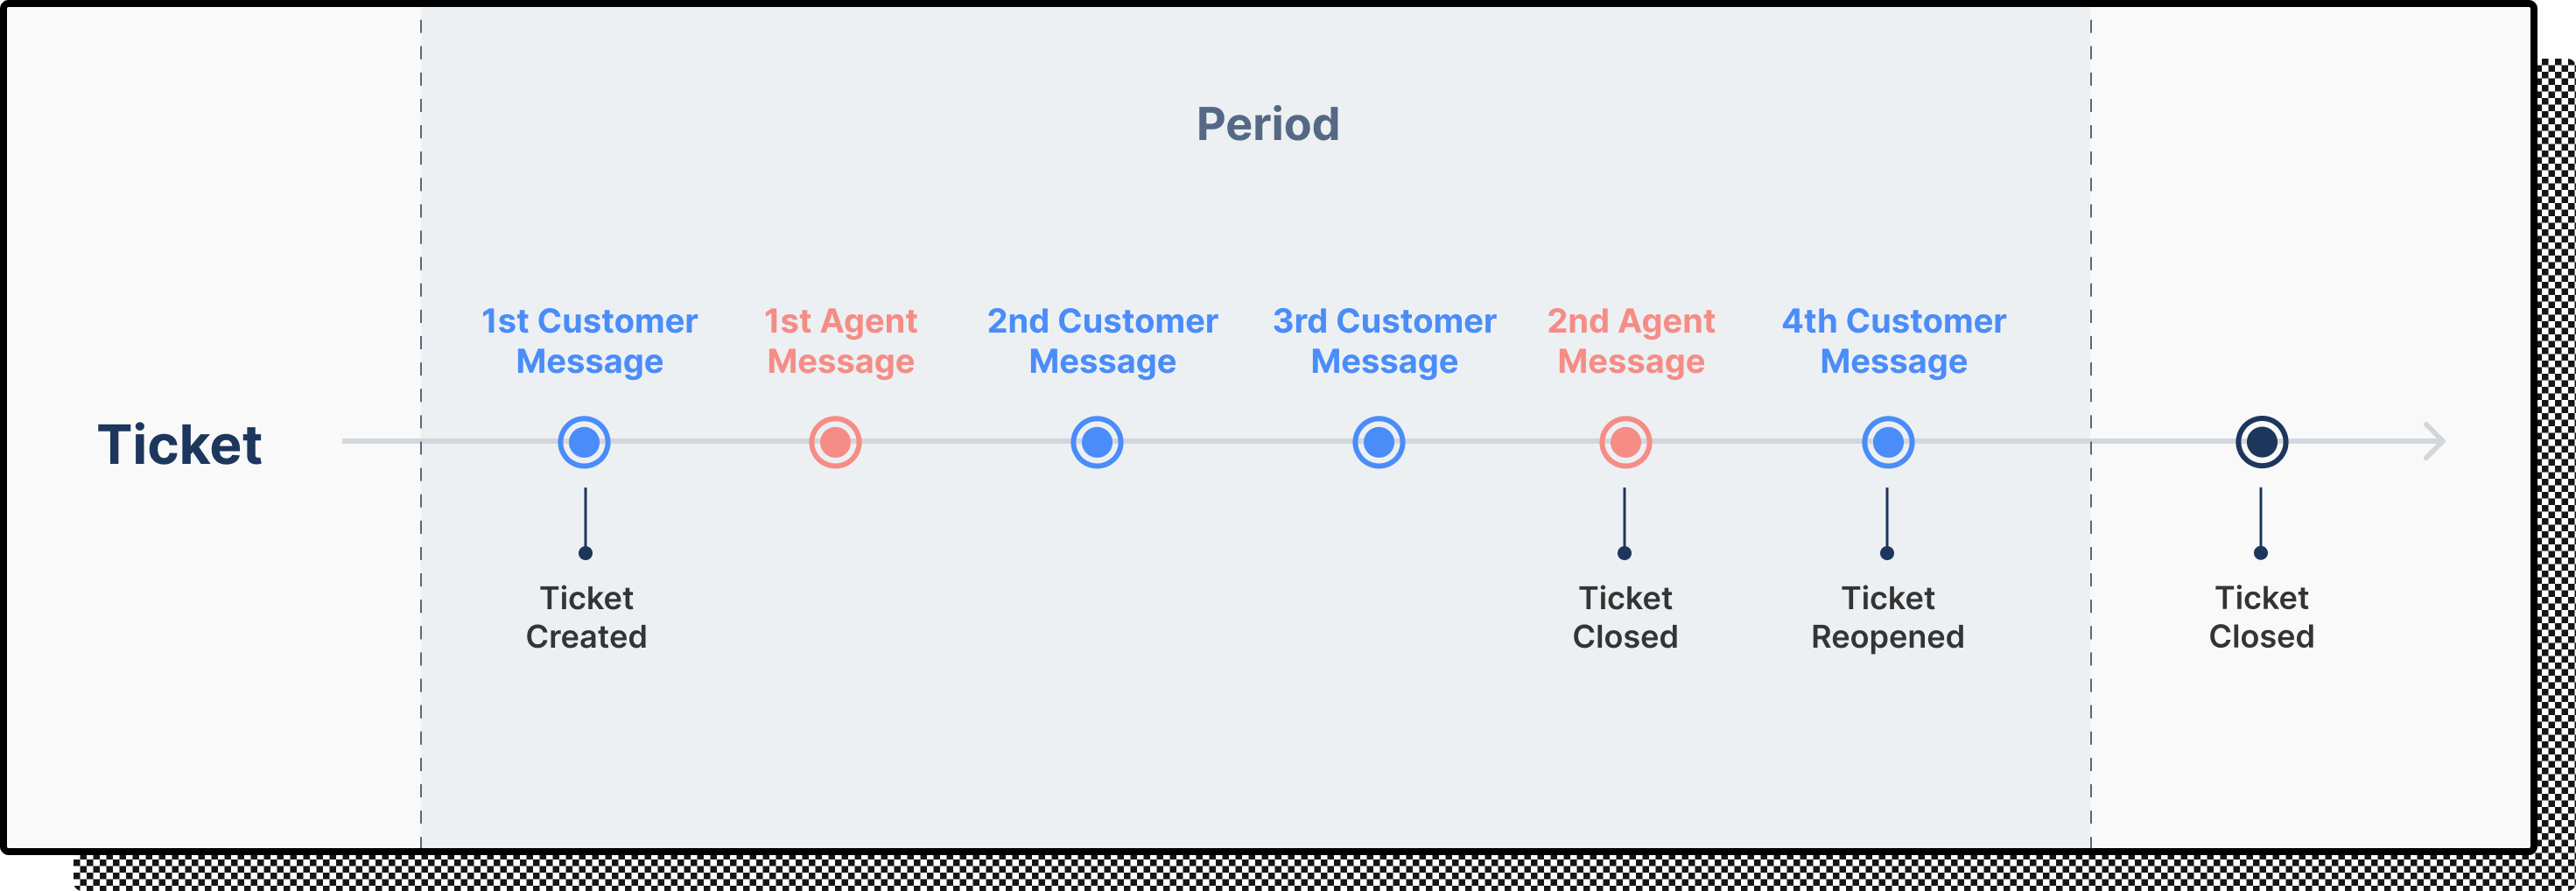
Resolution time refers to the amount of time a customer has to wait for their issue(s) to be resolved. This is calculated from the first message received from the customer until the ticket is closed.
To determine the median resolution time, we calculate the time between the first customer message and the final closure of the ticket.
This ticket will be included in the computation.
Metrics that can also be computed using the ticket presented as an example are First response time, Message per ticket, Tickets replied, and Messages sent.
This example isn't included since the ticket has been reopened.

Metrics that can also be computed using the ticket presented as an example are First response time, Open tickets, Tickets replied, and Messages sent.
The system only counts tickets that are closed at the end of the period (including tickets that have been automated with Rules and Automate, and with at least 1 customer and 1 agent/Rule message.
Messages per ticket
The total number of messages sent and received by the customer before their issue is solved, in other words, the Average number of messages exchanged per closed ticket - it's only computed for closed tickets.
The following tickets will be included in the computation.
Metrics that can also be computed using the ticket presented as an example are First response time, Tickets replied, messages sent, Resolution time, and Closed tickets.
This example isn't included since the ticket has been reopened.
Tickets created
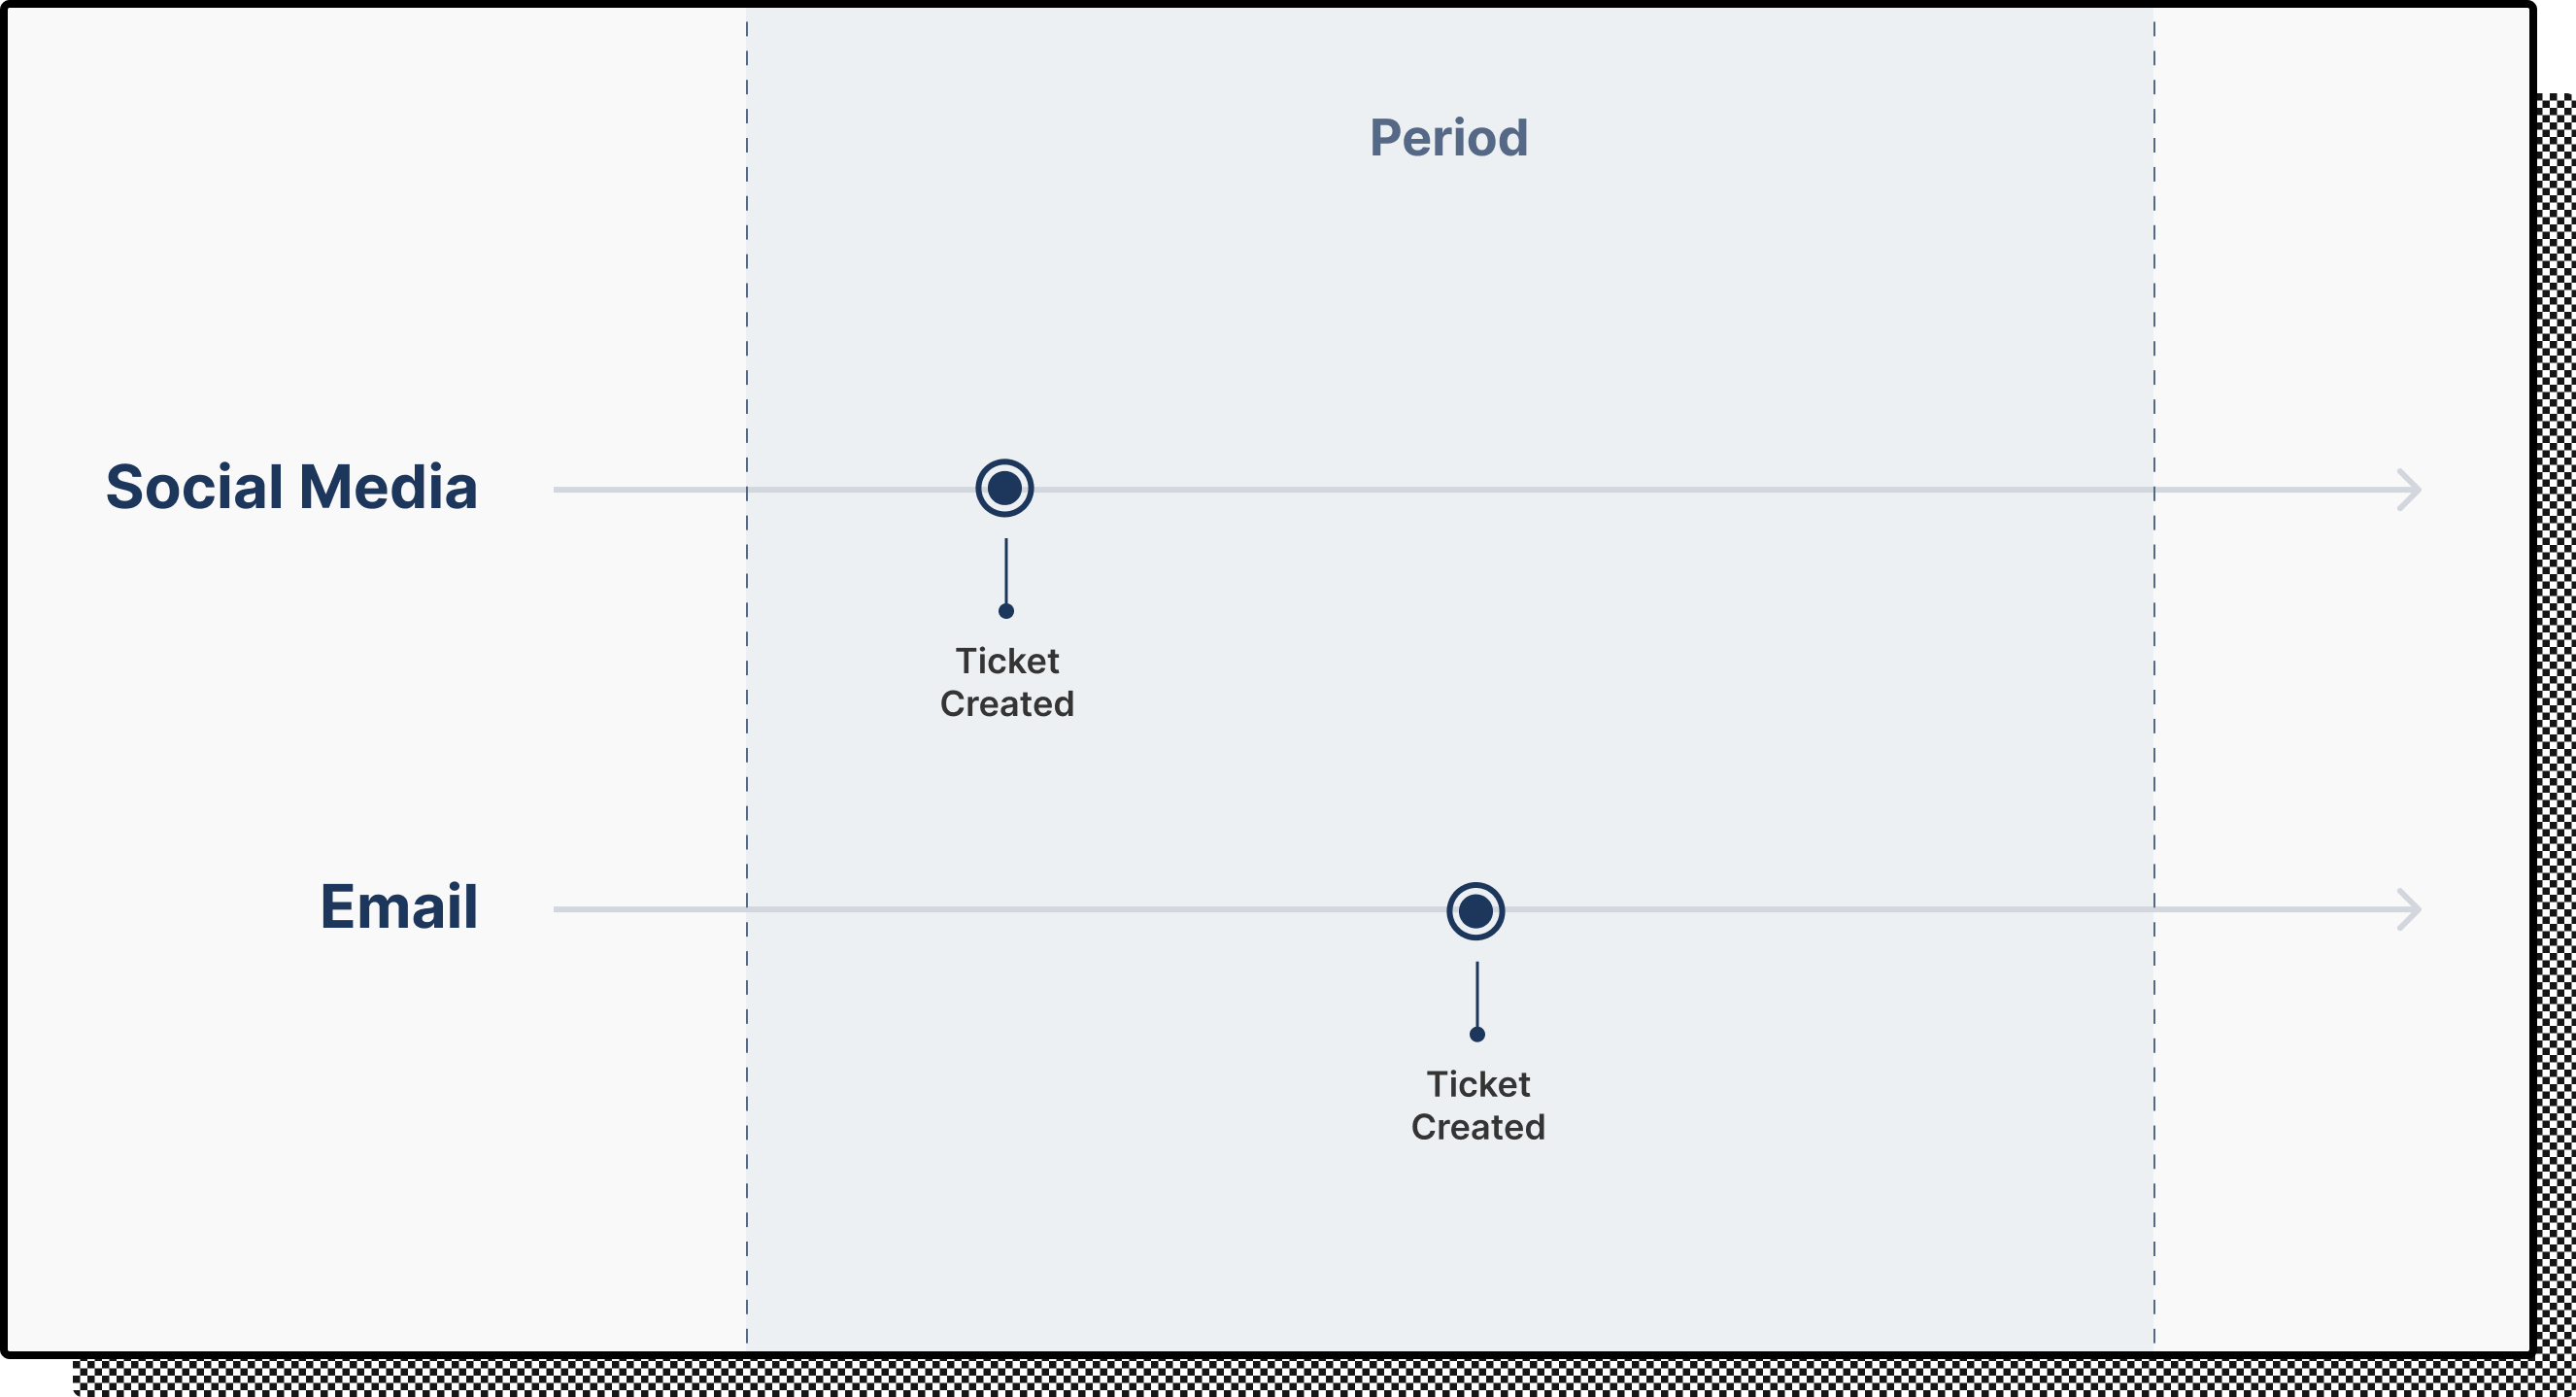
The number of new tickets created and new tickets to handle. It's important to be aware that certain channels may have a ticket-created datetime that predates the first customer interaction with the post. For example, social media posts may be older than the initial customer engagement that generates the ticket creation.
Here's one example of this:
Closed tickets
The metric measures the number of open tickets successfully resolved by the end of a specific period. It excludes tickets that were closed but later reopened before the end of the same period. Snoozed tickets will also count toward the closed tickets count until they are reopened.
This ticket will be included in the computation:
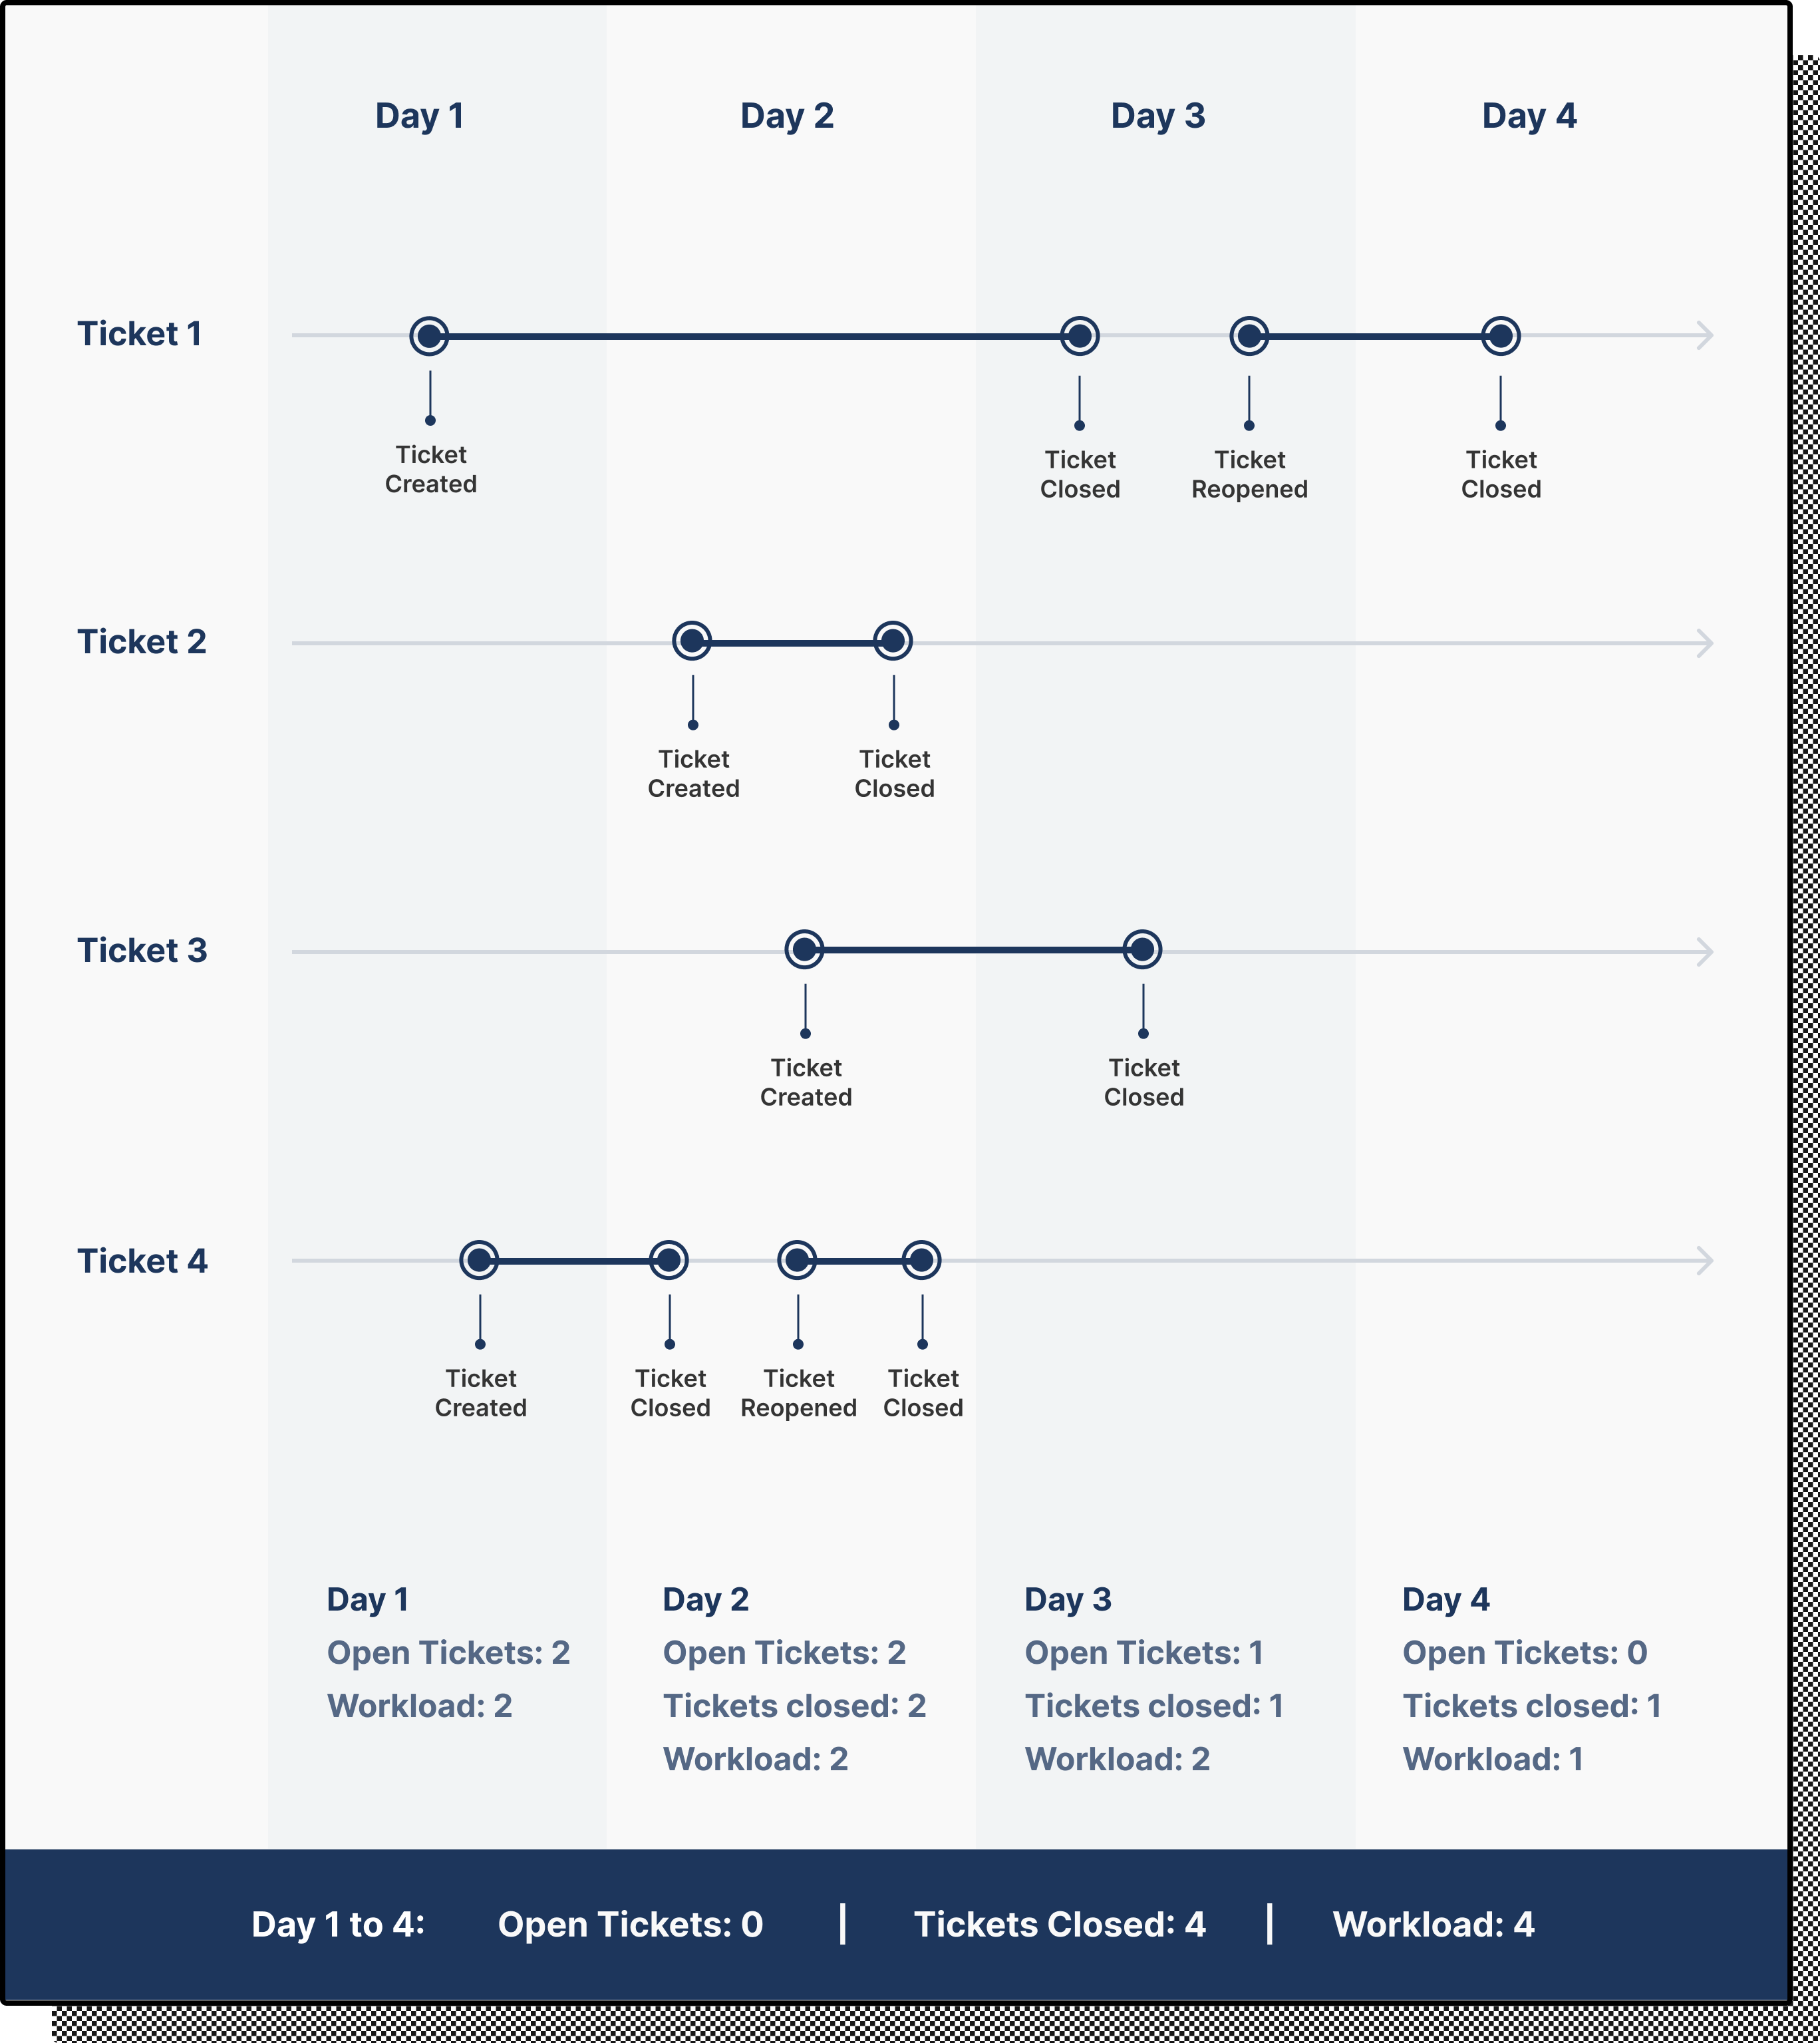
Metrics that can also be computed using the ticket presented as an example are First response time, Resolution time, Messages per ticket, Tickets replied, Messages sent, and Closed tickets.
This example isn't included since the ticket has been reopened:
Open tickets
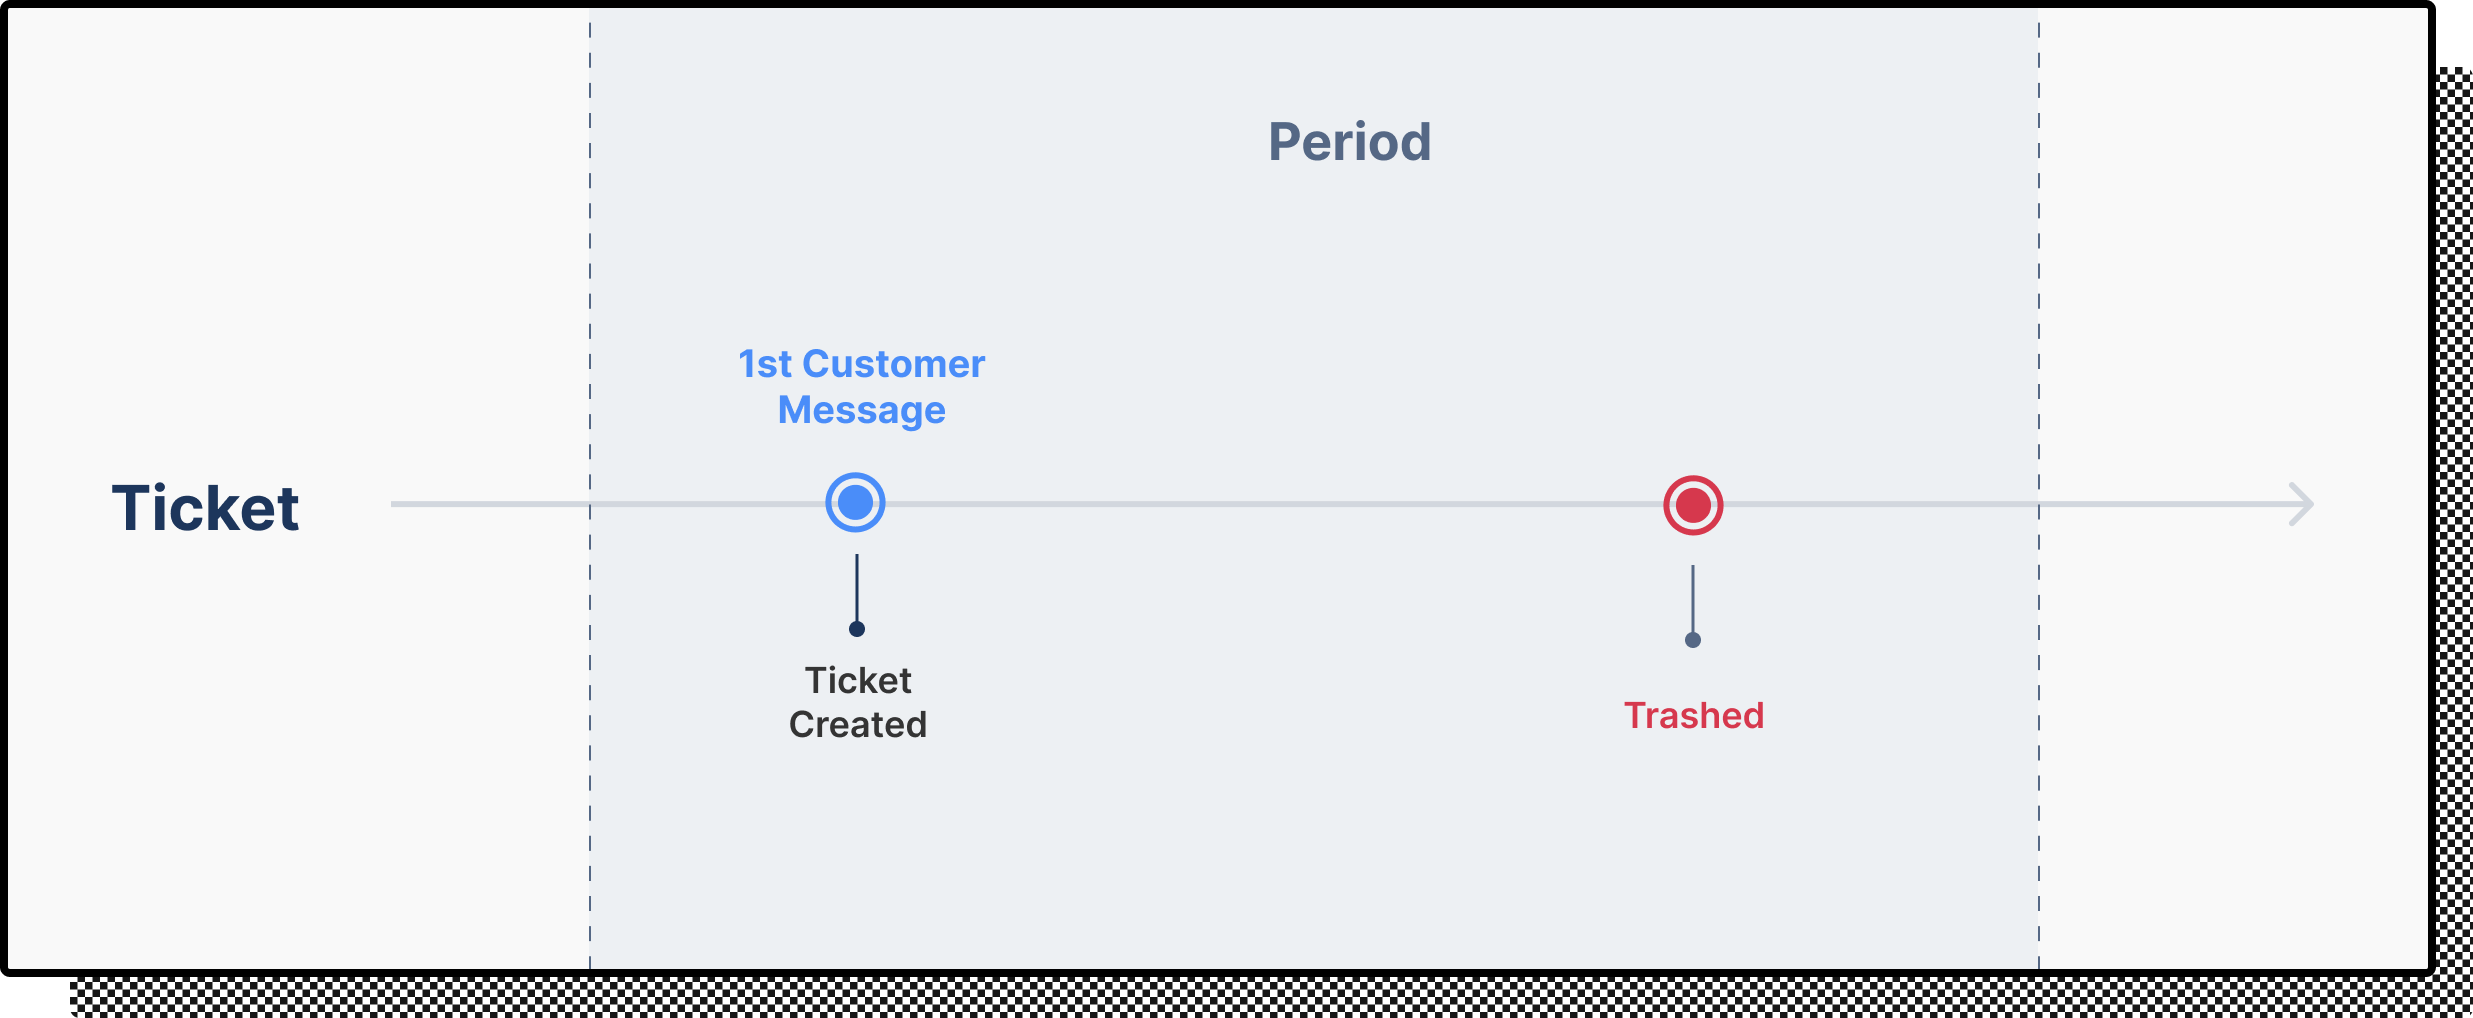
All tickets that haven't been handled and closed by the end of the selected period (including reopened tickets). Open tickets correspond to the backlog of tickets for the next period
The Open tickets number should be equal to the number of tickets in a View showing all open tickets at the end of a period.
The following tickets will be included in the computation:

This ticket wouldn't be included since the ticket was trashed during the period:
Workload per channel
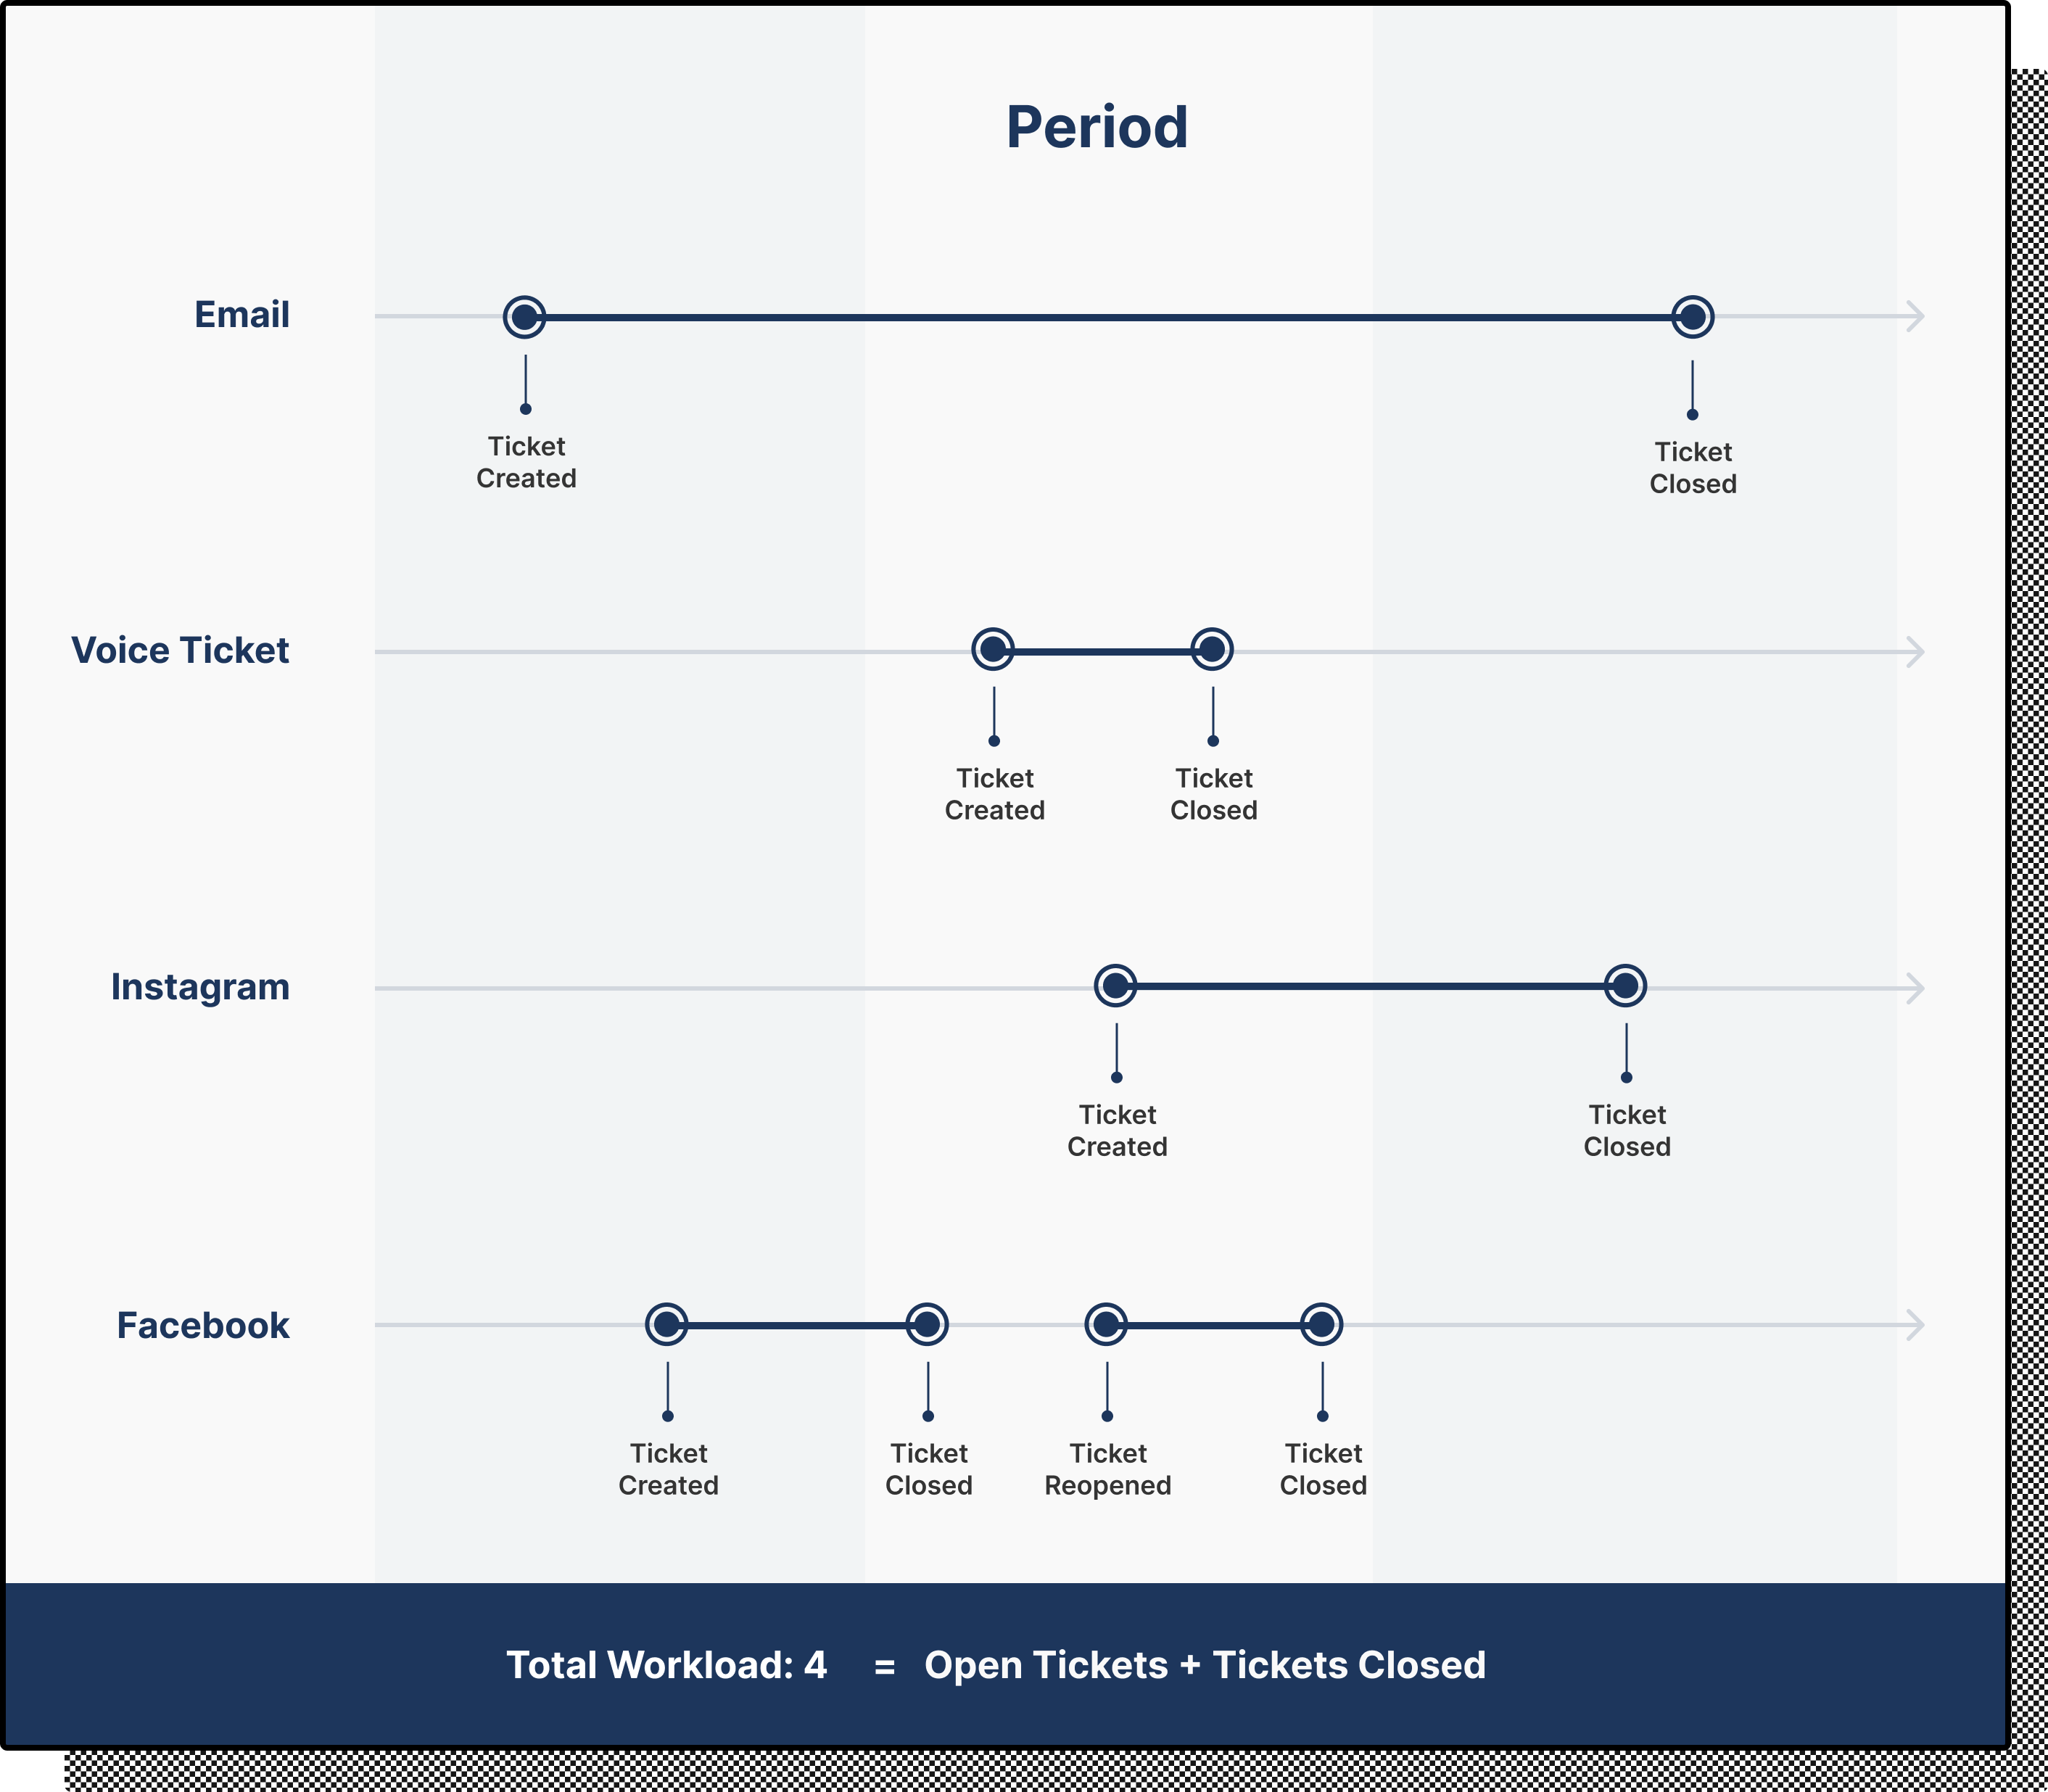
This graph shows the total number of tickets per channel your team had to handle during the chosen period. This is calculated as the sum of Open Tickets and Closed Tickets for each channel.
There are 4 tickets in this example:
Tickets replied
The number of tickets where the shopper got a response (considers only agent responses and excludes internal notes).
Here's one example of this:
Messages sent
The number of messages received by your shopper from human agents (considers only agent responses and excludes internal notes).
Here's one example of messages included in this metric:
Ticket handle time
Ticket handle time metric will allow you to understand your team’s productivity and forecast your staffing needs. It’s the average amount of time that all agents spend on a ticket while it's in an open status. Only tickets that were closed during the selected period will be taken into account.
This differs from Resolution time because it only accounts for the actual time the agent was actively working in Gorgias Helpdesk, whereas Resolution time shows the total time from the first message in the ticket until it was closed, regardless of the idle time between interactions.
For a given ticket, the metric takes all the time that any agent spends with the ticket as an active tab in their browser (i.e., screen time). In the example below, if you open a new tab, the stopwatch stops.
The timer pauses when the agent navigates away from the ticket, either by closing the tab/browser, moving to a different page inside Gorgias, switching or opening another tab, minimizing the browser, or visiting a different website (through a widget link or direct URL). We will also stop the timer when the agent logs out.
With phone tickets, the handle time is calculated as the sum of call duration time and ticket viewing time.
If the agent filter is used, the metric will only take the tickets that are assigned to the user to compute the average. However, the timer adds the time that any user has spent viewing the ticket. We currently track only time spent in the browser and can't account for time spent viewing the ticket in Gorgias mobile app.
Re-opened tickets do not have a handle time until they are closed again. Once closed, the handle time is the entire time agents spend on the ticket, including time spent on the ticket before it was reopened. If the agent views a closed or snoozed ticket, that is not added to the handle time.
One-touch ticket
Percentage of tickets closed within the selected timeframe with exactly one message sent by an agent or rule.
If the agent filter is used, it will show the percentage of tickets assigned to the selected agents. If the team filter is used, it will show the percentage of tickets assigned to any agent of the team.
