Review ticket quality in the Auto QA reportUpdated 11 days ago
You can use the Auto QA report to get full visibility into the quality of your teams’ interactions with customers.
As your agents close conversations with customers, Gorgias uses Auto QA to automatically evaluate and assign a quality score to their tickets. In your Statistics, you can then use the Auto QA report to understand the overall quality of your teams’ tickets and identify opportunities to coach individual agents and increase compliance.
Requirements
- You must have an active AI Agent subscription
- You must be a Team Lead or Admin to view the Auto QA report
Reviewing and filtering data
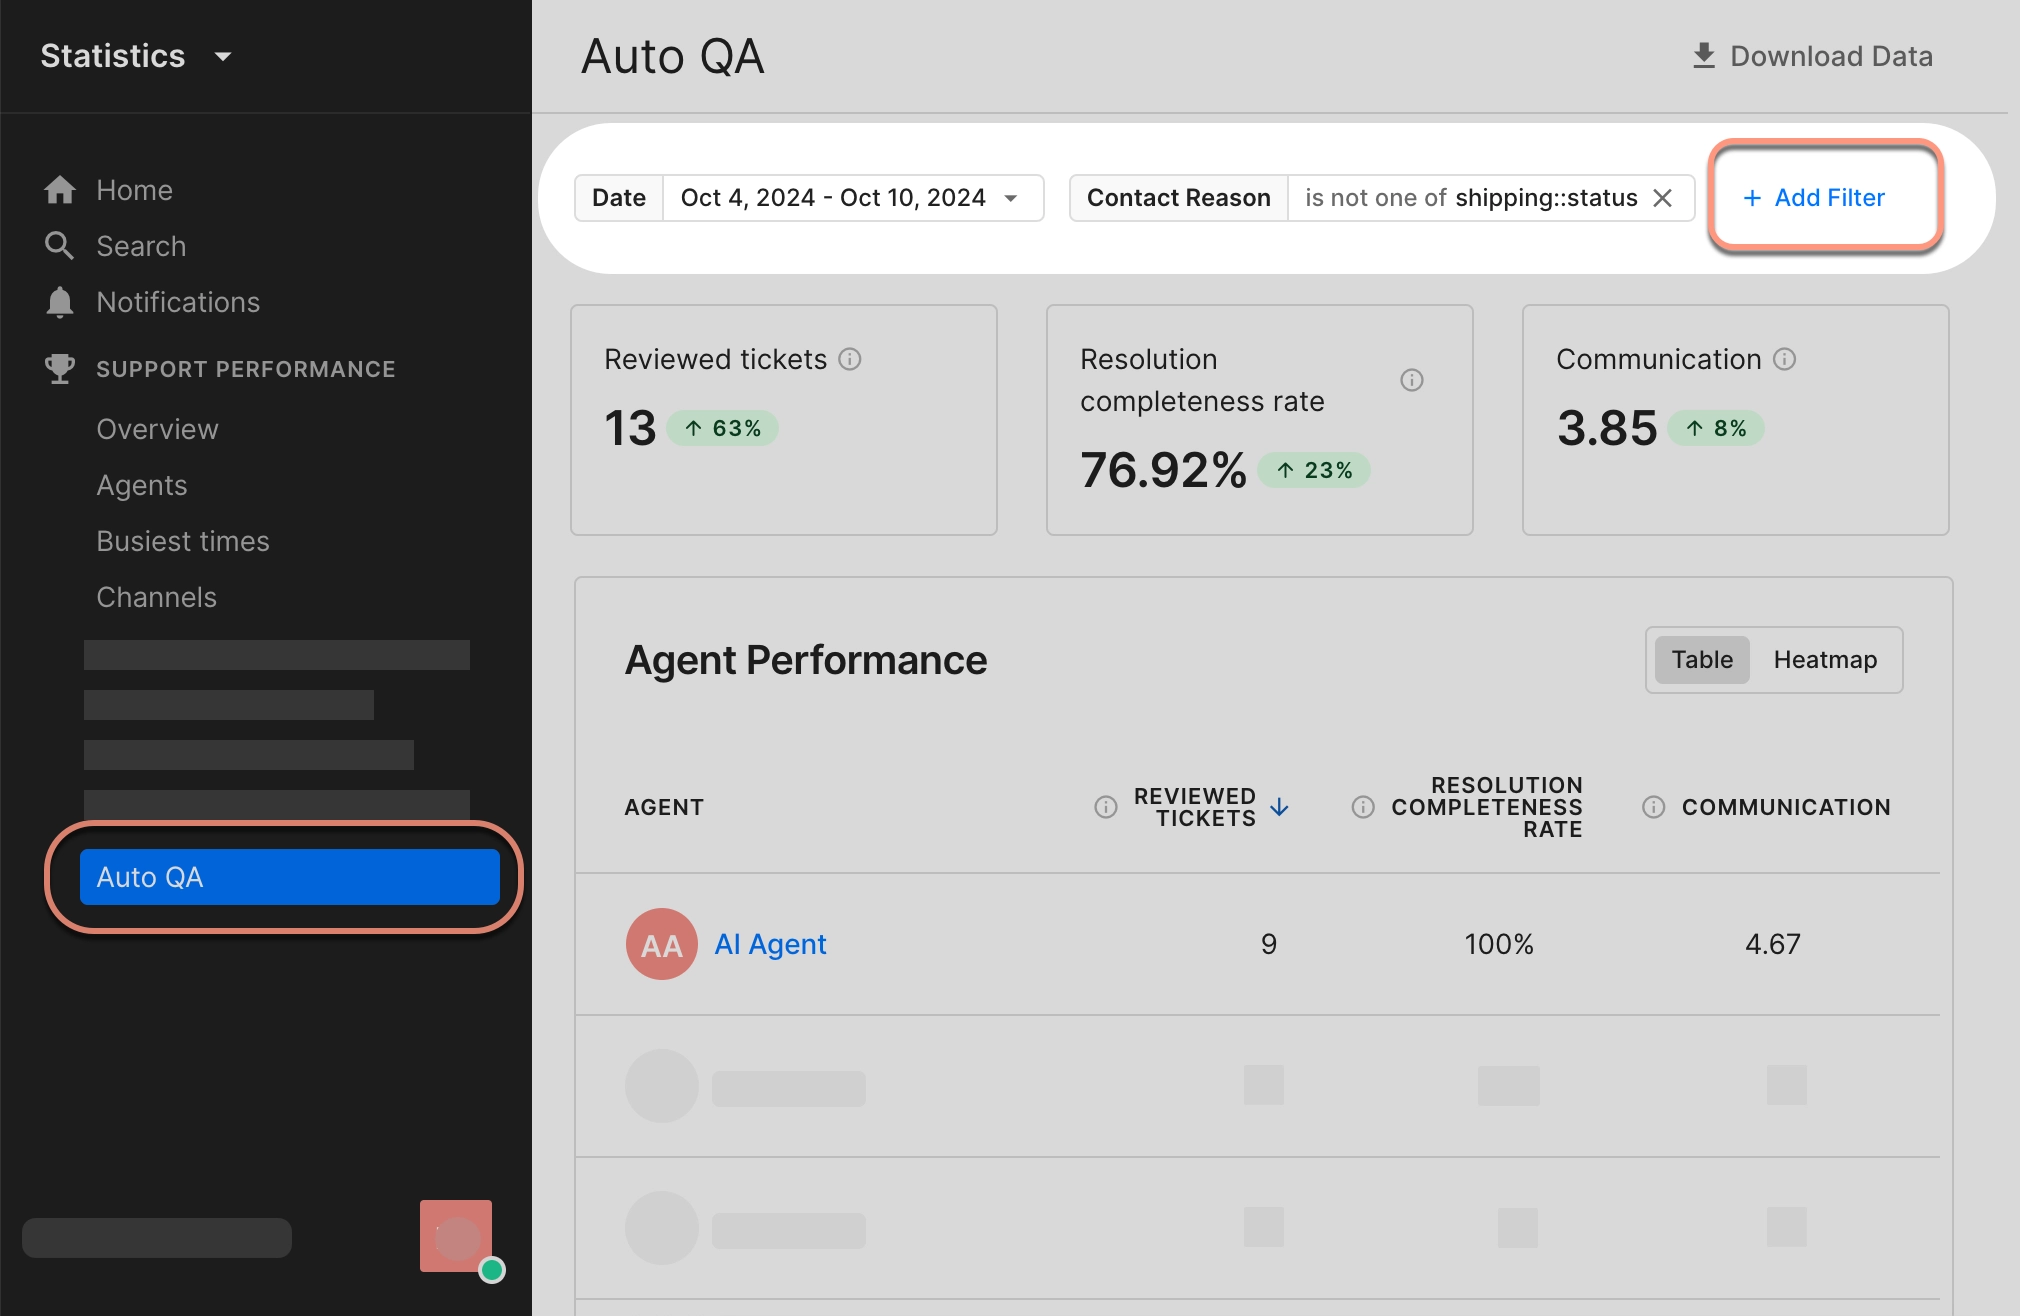
Open the Auto QA report in your Statistics to review the data for your account. Use the filters to adjust and change your view of the data.
- Select Statistics from the main menu
- Select Auto QA to open the report
- Open the Date menu to adjust the report’s time frame
- Choose a preset date range (for example, 7/30/60/90 days) or use the calendars to select a custom date range
- Select + Add Filter to filter the data by different criteria
- You can filter data by Agent, Channel, Integration, Tag, or a value from one of your custom Ticket Fields (for example, Contact Reason)
- Use Is one of or Is not one of to include or exclude data from the report
- You can filter data by Agent, Channel, Integration, Tag, or a value from one of your custom Ticket Fields (for example, Contact Reason)
Reading data in the Auto QA report
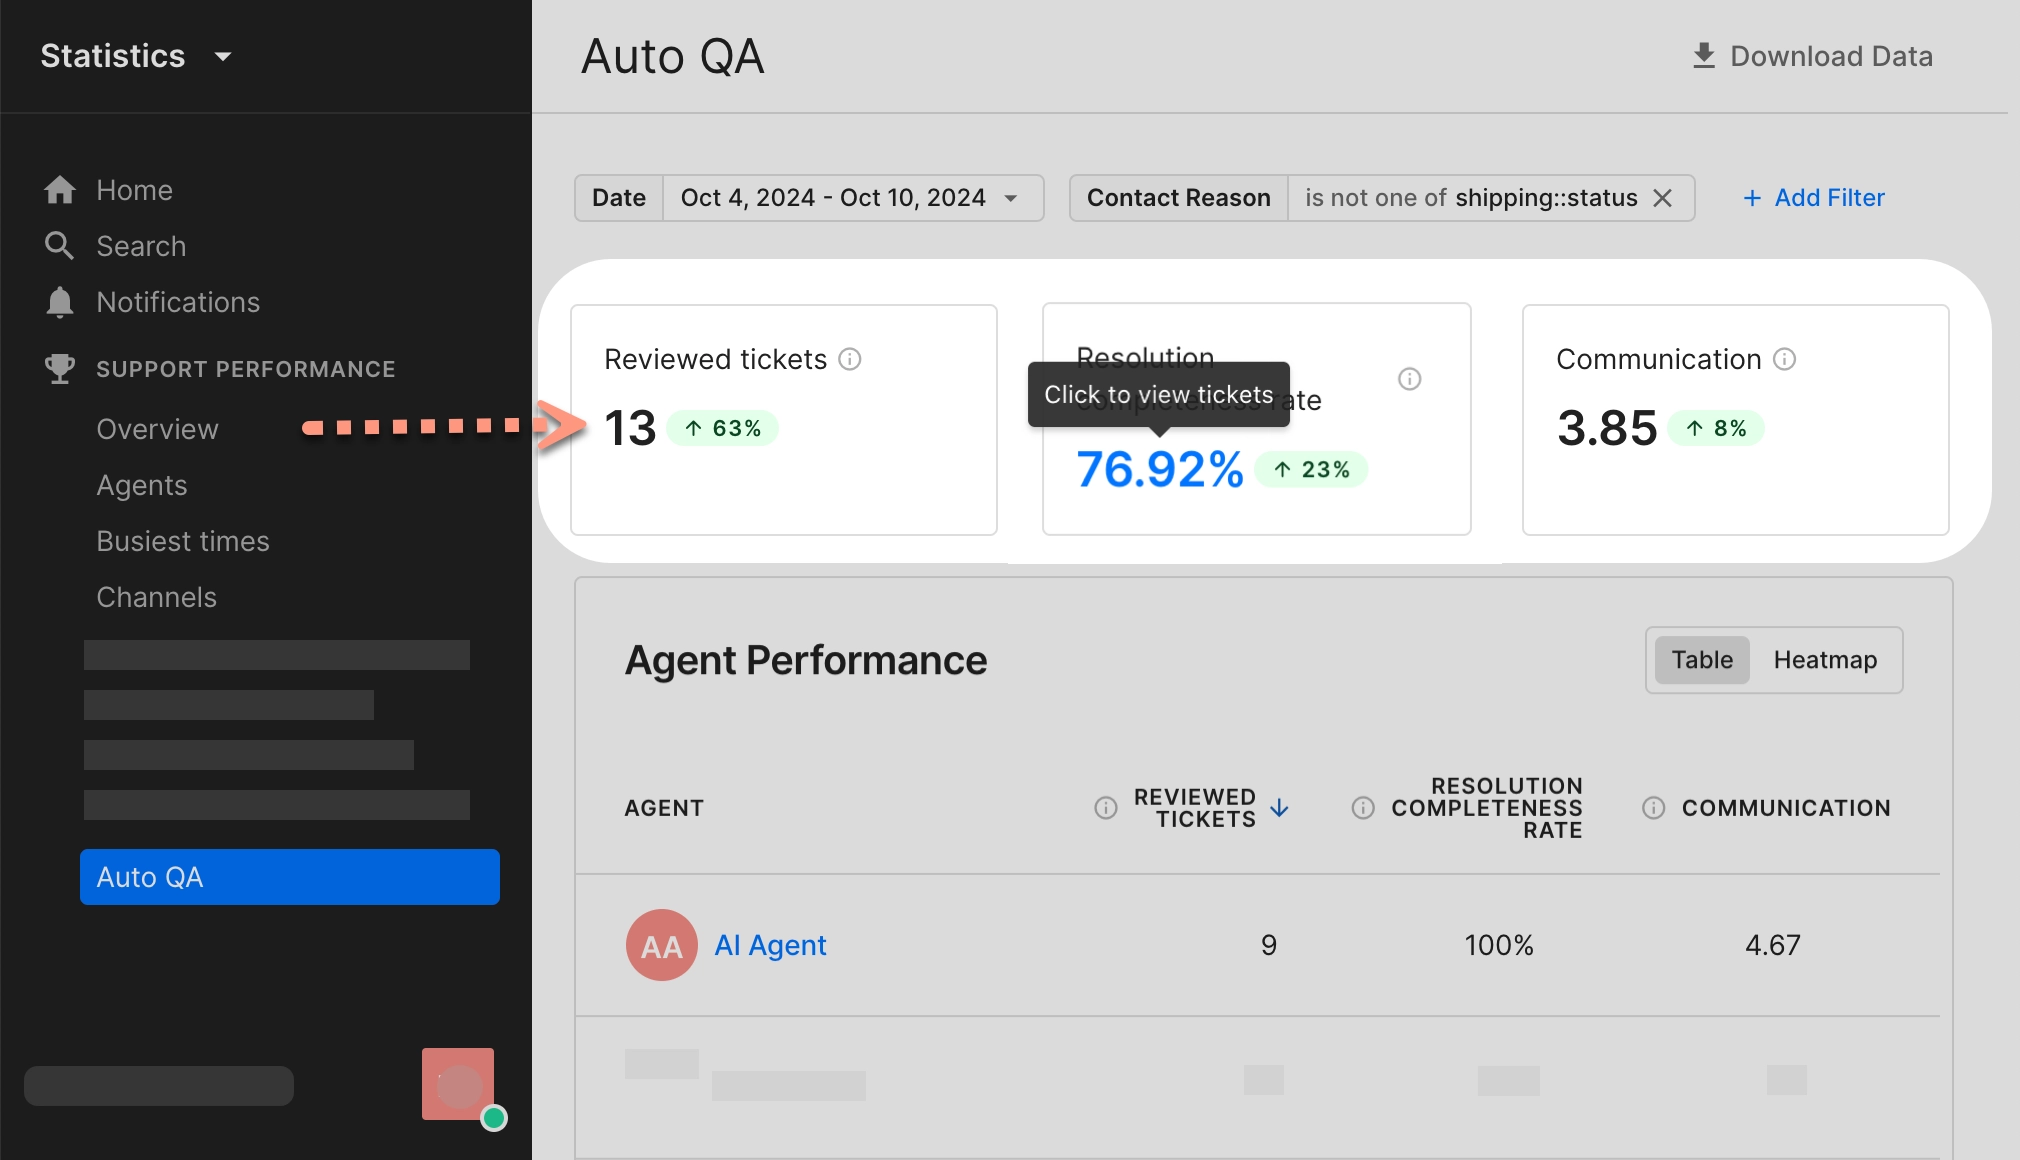
The Auto QA report brings together the scores that Gorgias’ AI and your human reviewers assign to your teams’ tickets. Learn more about the criteria Auto QA uses to score tickets.
From the report, you can review the overall quality of your teams’ work, and then drill down into each of the key quality metrics to get a detailed view of the tickets that comprise each score.
Here’s a breakdown of the main quality metrics in the report:
- Reviewed tickets: see how many tickets were scored by Auto QA and human reviewers during your chosen date range
- Resolution completeness rate: see the percentage of tickets where the agent(s) addressed all customer inquiries
- Communication: see the average score given to your agents’ tickets for empathy, clarity and active listening skills.
- Language proficiency: see the average score given to your agents' tickets for their use of language, including spelling, grammar and syntax.
- Accuracy: see the average score given to agents for providing accurate information resolving tickets
- Efficiency: see the average score given to agents for how quickly tickets were handled with minimal touches
- Internal compliance: see the average score given to agents for following internal processes, like applying the correct tags and macros, following proper steps for escalations
- Brand voice: see the average score given to agents for using your brand's correct vocabulary, greetings, sign-offs and tone of voice
Drilling into the data
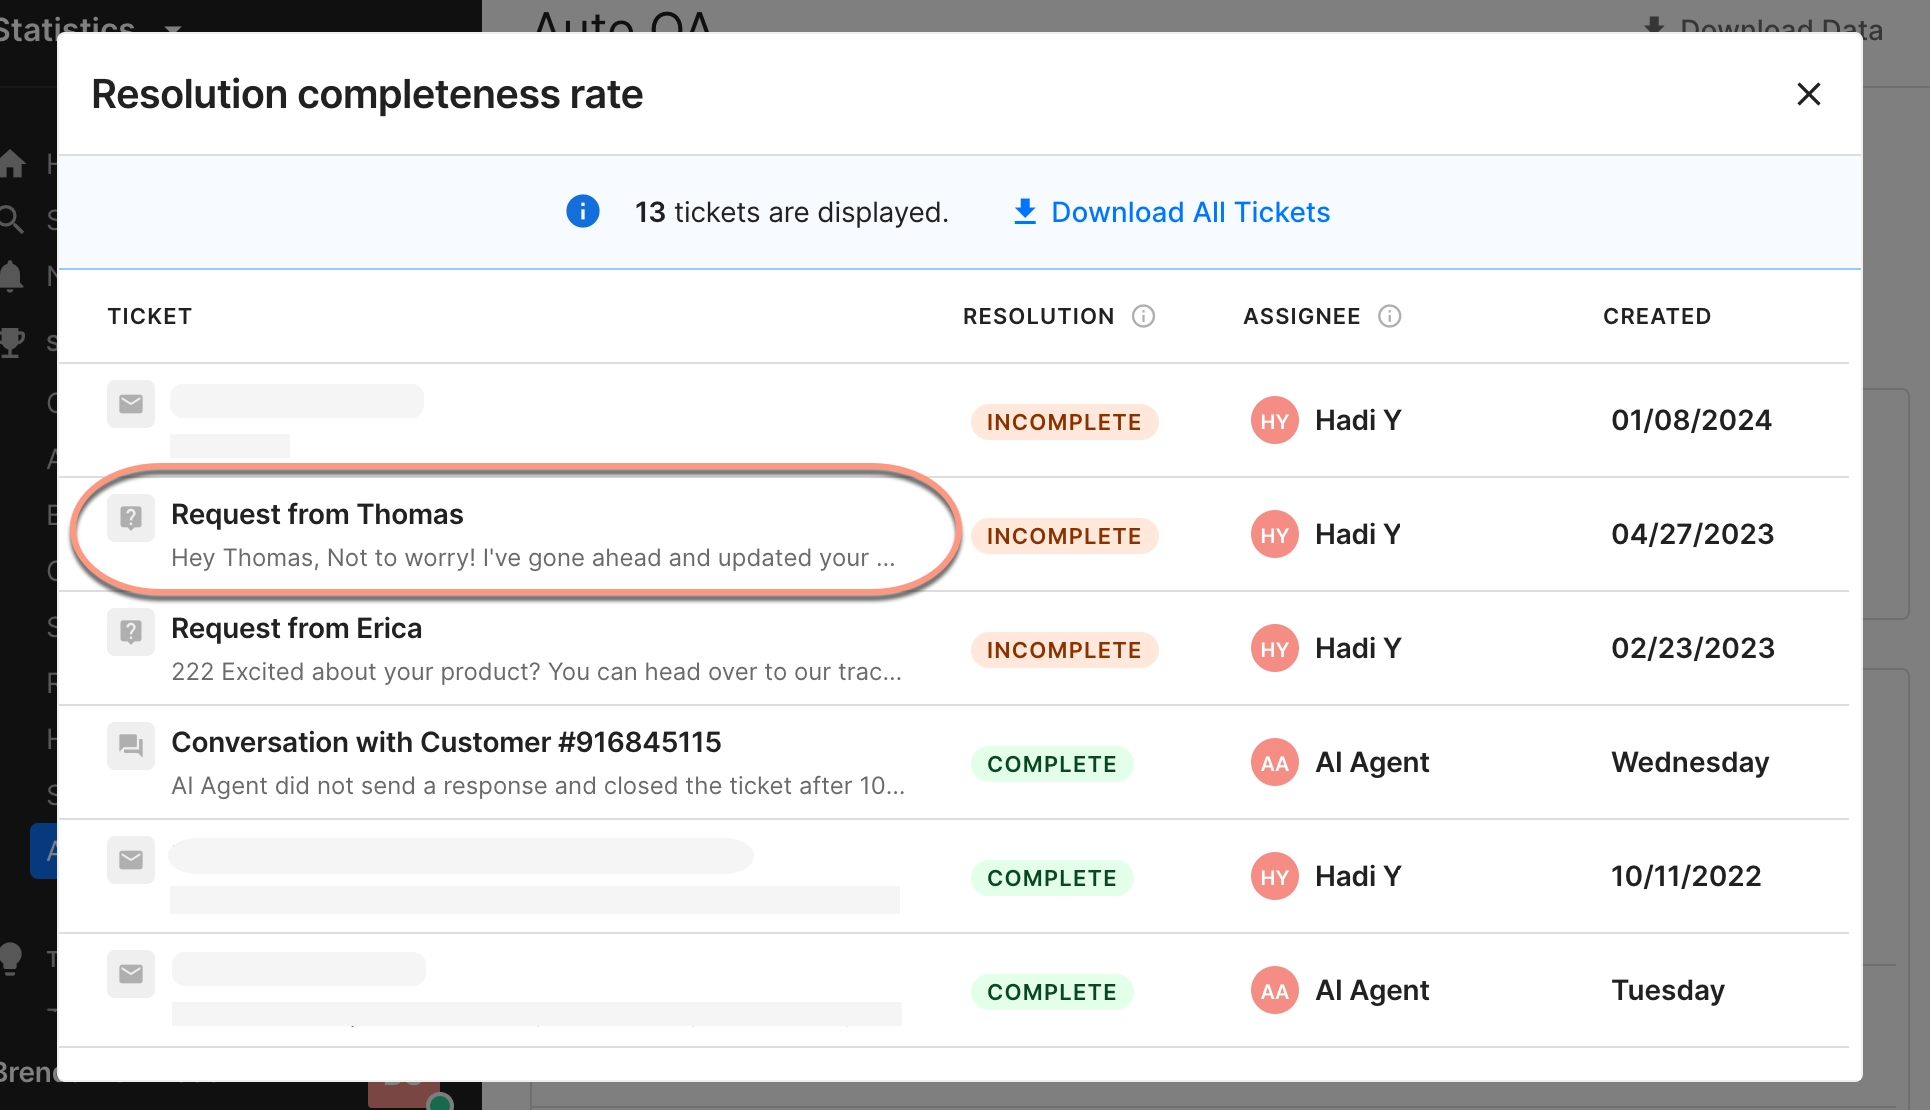
To get a more detailed view of the data, select any of the quality metrics from the charts (reviewed tickets, resolution completeness or communication) to expand the report.
From here you can see all of the individual ticket scores that make up your overall rating, as well as the corresponding tickets.
Select any ticket to open the original conversation and see its specific score.
Reviewing agent performance
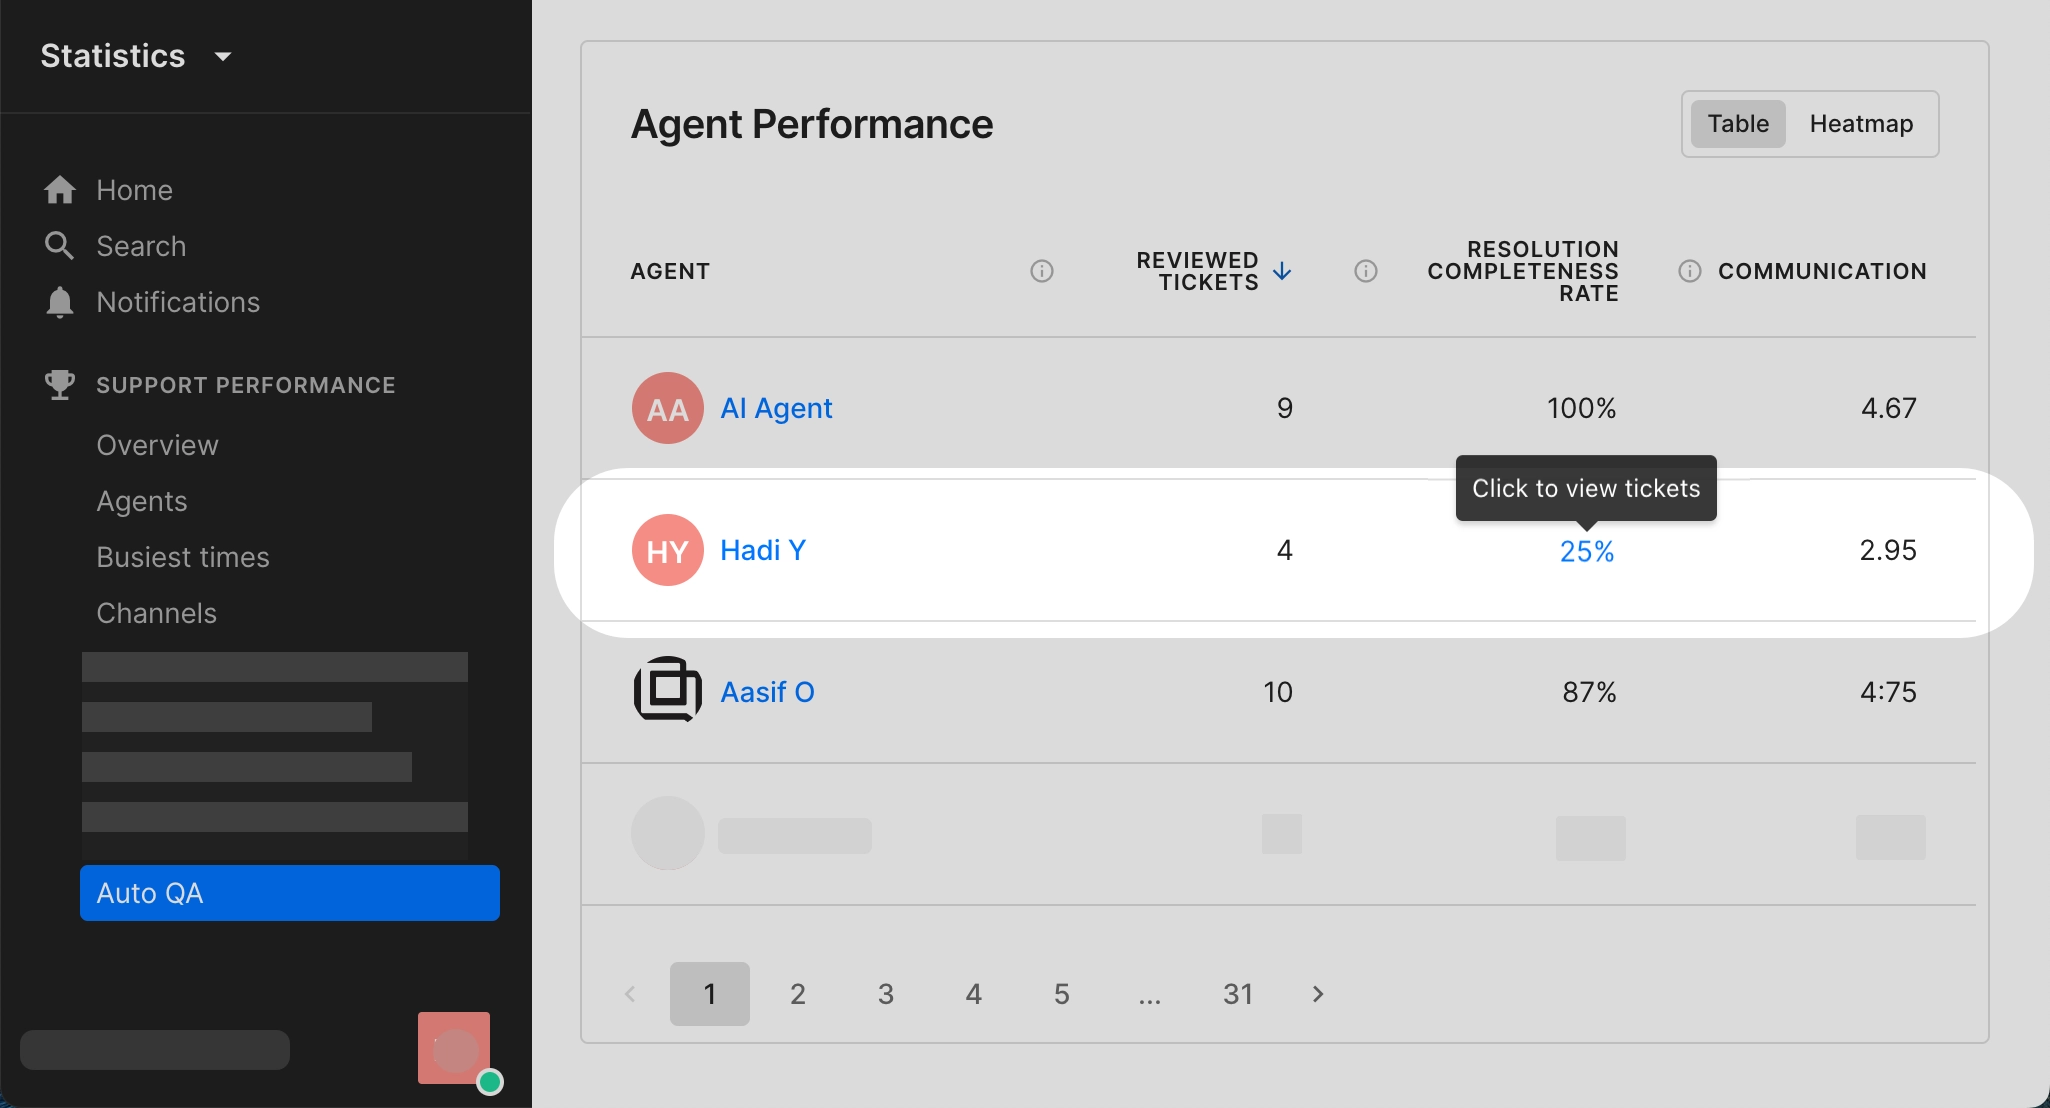
Using the Agent Performance section of the Auto QA report, you can review the average score for each quality metric given to an individual agent’s tickets.
- Select any of the individual quality metrics for an agent to open an expanded view of the data and their corresponding tickets
- Select any ticket in the expanded view to open the original conversation and see its specific score
- Select the name of an agent to open the Support Performance Overview report and review related metrics for the specific agent — including, CSAT, First Response Time, Resolution Time
Downloading data from the Auto QA report
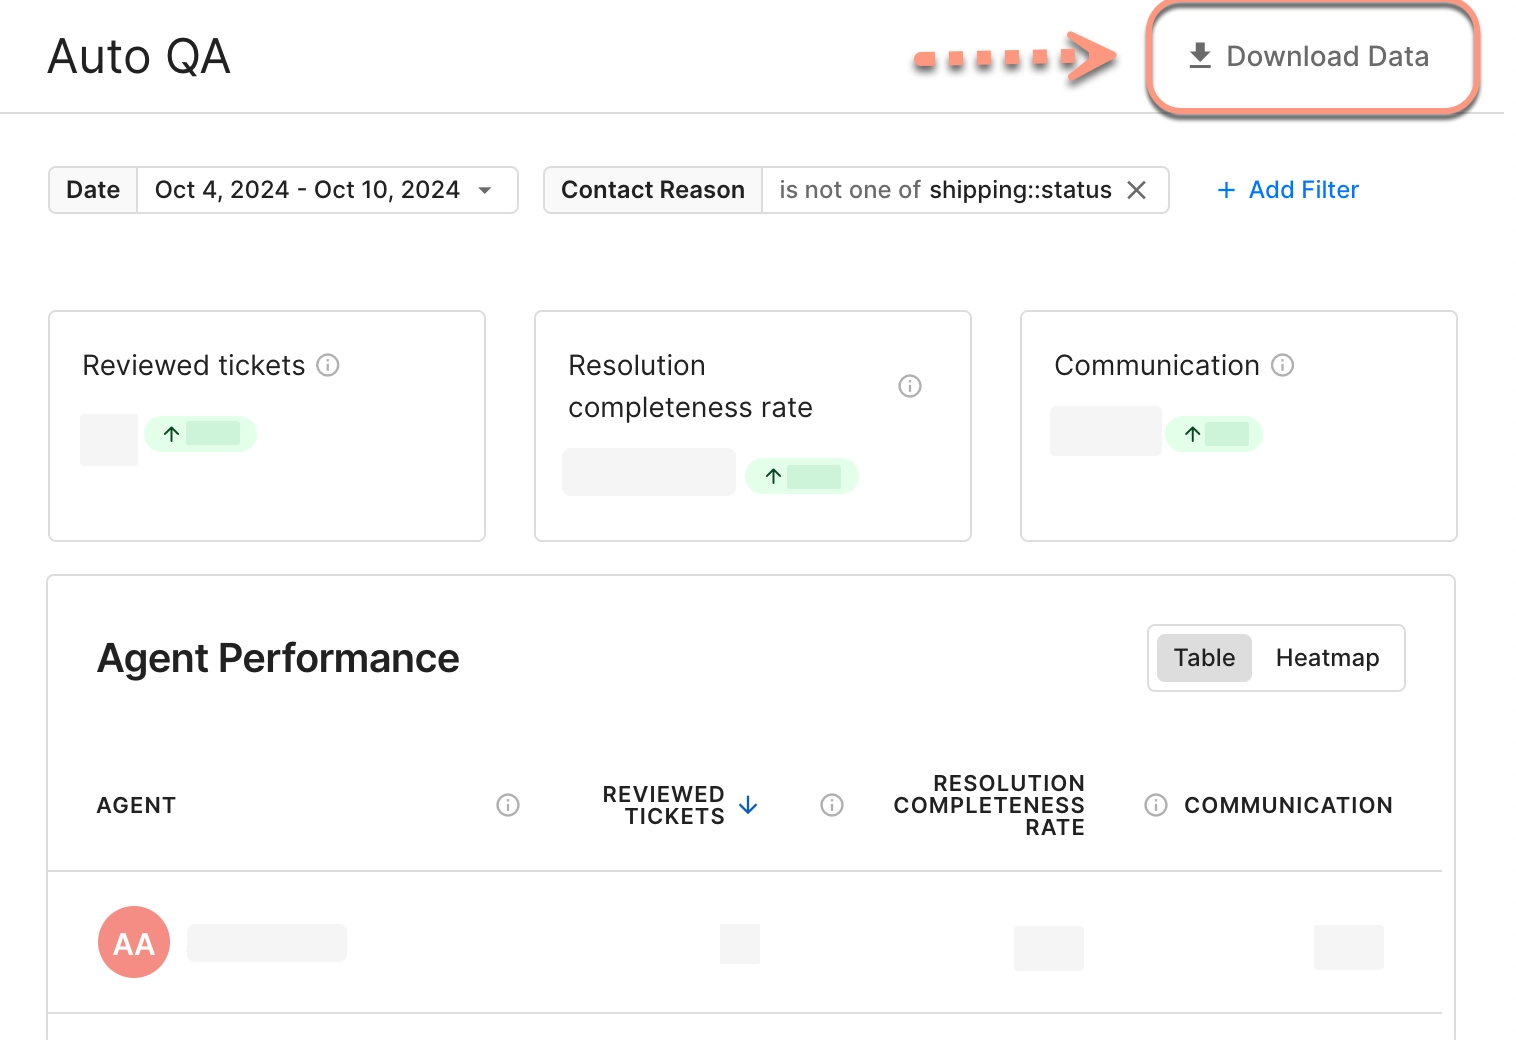
Select Download Data at the top of the report page to export your data to a spreadsheet.
The download contains two CSV files:
- One CSV file contains rows to compare each of your quality metrics (Reviewed tickets, Resolution completeness, Communication and so on) for the current date range against the previous period.
- The second CSV file contains rows for each of your agents showing how they individually scored on each of the quality metrics for the selected date range: Reviewed tickets, Resolution completeness, Communication, Language proficiency and so on.
Downloading ticket data
You can also download data about the tickets that make up the quality scores you see in the report. You might want to examine ticket data in a spreadsheet or upload it to another tool for further analysis.
The data includes standard information about tickets, including ticket IDs, tags, the channel where the conversation started, the subject, agent name, dates, as well as the quality scores given to the tickets for completeness and communication.
- Select any of the quality metrics from the charts in the report (reviewed tickets, resolution completeness, communication or language proficiency) to expand the data
- In the expanded view, select Download Ticket Data