Ticket Insights StatisticsUpdated 7 days ago
This section of Statistics provides insight into ticket aspects like Ticket Fields, Tags, Macros, and Intents - components of tickets that provide more information about the type of ticket it is and the pre-made responses to them.
Sections
Ticket Fields
With the Ticket Fields report, you can see 3 charts (Top Used Values, Trend, and All Used Values) that show you an overview of the most common values used for a given Ticket Field and their evolution over time.
You can also see a detailed breakdown of all Ticket Field values used during a specific time period.
Please note, the charts in this report only contain statistics for dropdown-type tickets fields.
Use the filters at the top of the page to adjust your view of the data in the report.
- Use the Report On menu to display results for a specific dropdown ticket field
- Use the Date menu to change the timeframe of the report
- Choose a preset date range (for example, 7/30/60/90 days) or use the calendars to select a custom date range
- The report will display tickets that and had a ticket field value applied within the selected timeframe
Top used values
This table features the top 10 values used during the period (the number of tickets labeled with this value), as well as their relative proportion. All other values are grouped into the Outside of Top used category.

It helps to answer what the most common contact/product/…. (value of this field) are and what the distribution of the top problems versus all problems is.
Trend
This chart features the top 10 values used during a selected period and their evolution over time. You can select which value to display by clicking on their name in the legend.
It helps to answer how the most common contact/product/(value of this field) evolves over time and whether it's persistent or if there's a spike during a specific period (like during BFCM).
All used values
This table features all values used during a specific period broken down by period (automatically set) - you can drill down into all the categories and sub-categories and see the number of tickets that received each label.
You can toggle between the absolute value (#) and relative value (%), and activate a Heatmap on top of the Table. The relative value is computed per column and will help you understand the variation in the proportion of your different issues over time.

It helps to answer what the most common groups or end values of contact reason/product/(value of this field) are to check volume variation and how the proportion of the issues evolved over time and at different levels.
Tags
The Tags section will show you how many tickets (with included links) that have a certain Tag attached to them were created during a specific time period regardless of whether the Tag was applied manually or automatically.

You can also use the filters on the top right to change the time period and select specific channels, as well as download a CSV of this data using the icon on the right-hand side.
Macros
Here you can see a breakdown of the Macros sent during a specific time period - how many tickets had the Macro applied on them, what percentage of your tickets that is, and how it compares to the previous period.
 The top category, Without macro, indicates tickets no Macro was applied on.
Intents
The Intents section will show you the most frequent Intent detected in your received messages and how many times you had to correct a detected intent.

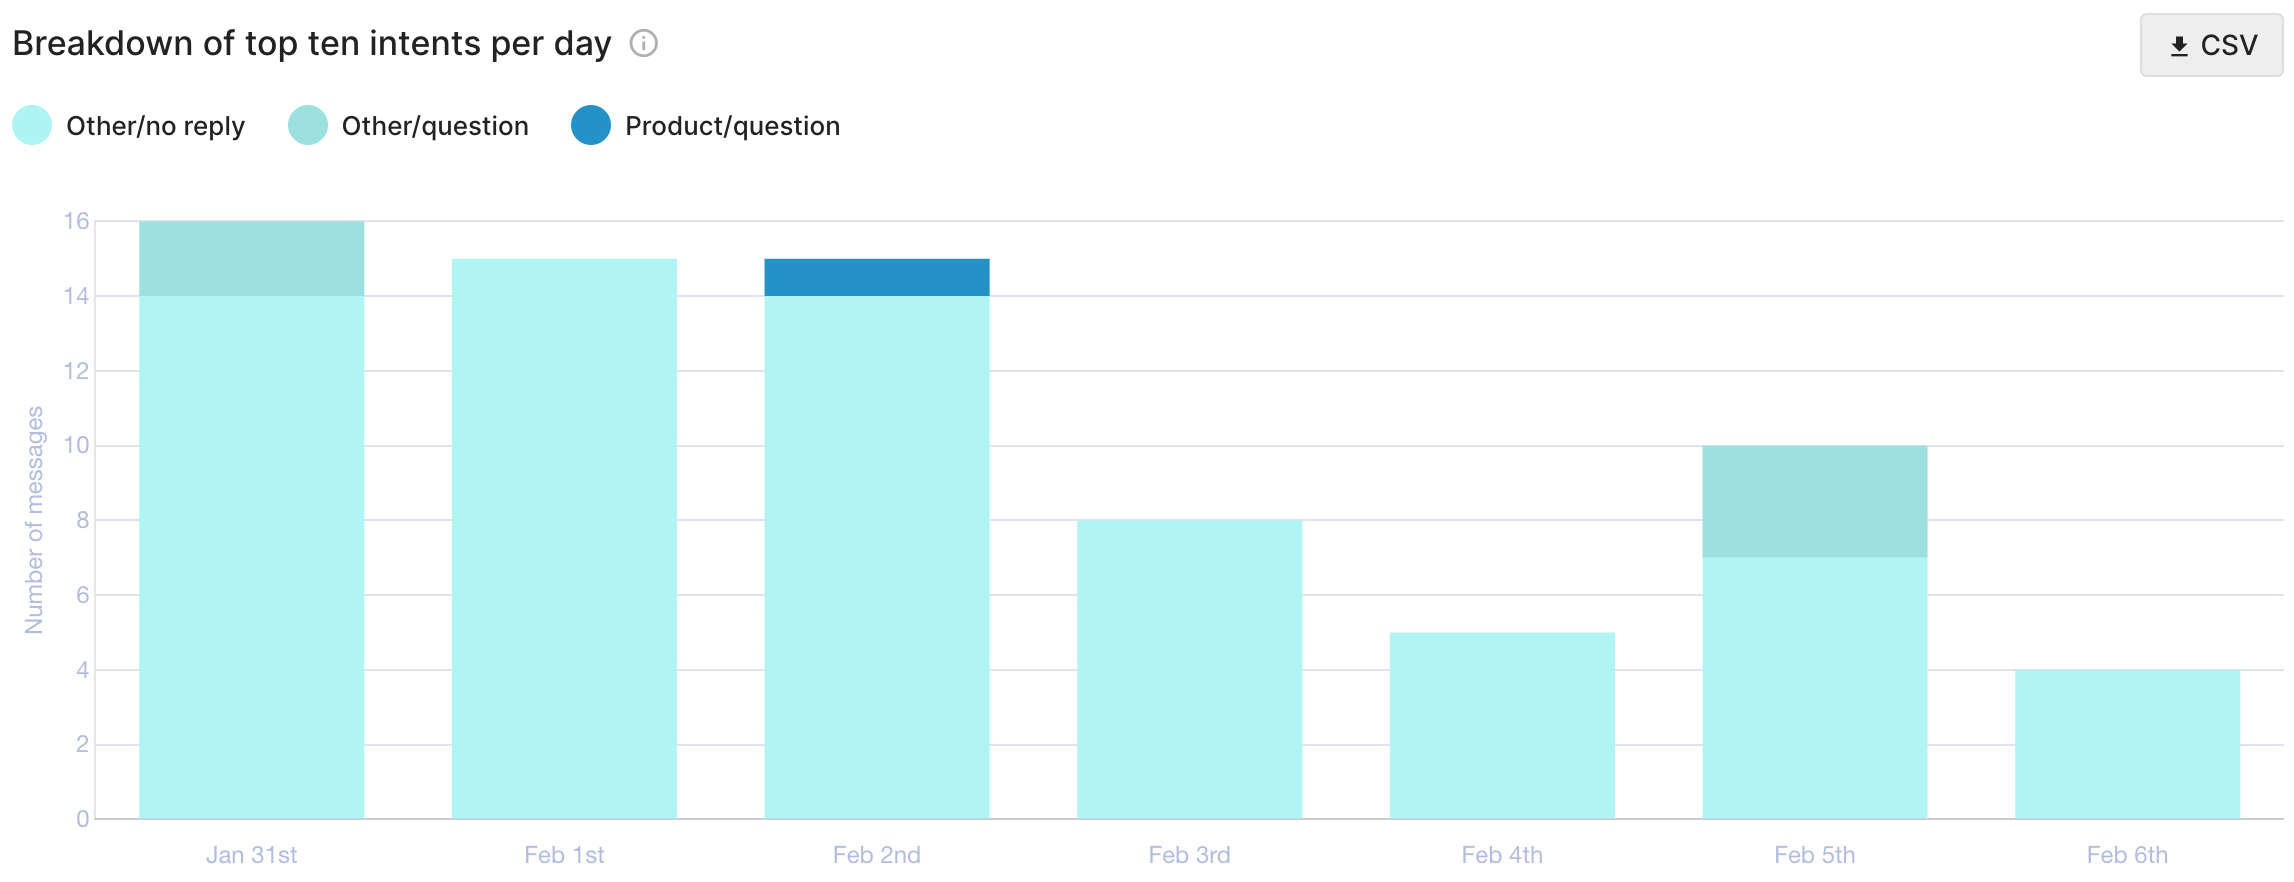
Breakdown of top ten intents per day
This graph will show you a breakdown of the top 10 Intents detected per day - you can also download this information via the CSV button on the right.

Breakdown of intent occurrence
Under that, the Intent occurrence section will show how many tickets a particular Intent was detected on, what percentage of your tickets that is, and how it compares to the previous period.
