Learnings from Help Center reportingUpdated 6 months ago
Having an informative Help Center greatly improves customer experience and contributes to time and cost savings.
It enables shoppers to find consistent information on your products and services 24/7 and helps build trust and brand recognition - it can even attract new customers by improving the visibility of your business.
By continually analyzing metric results and making data-driven decisions, you can enhance the effectiveness of your Help Center articles.
Here are some basic tips that you can start with:
- Informative titles - your customers need to know what the article is about
- Detailed excerpts - this complements the information provided in the title and helps with your Help Center indexing
- Smart formatting - put the most important information at the top and highlight the other significant details throughout the article
- Linking similar topics - it's usually better to have a separate article for each topic than to repeat the information in several different articles — this also improves the accuracy of AI Agent and automations like Article Recommendations.
- Accuracy - make sure that the information provided is up-to-date, so it doesn't lead to misunderstanding or further Support Team engagement
Identify your Help Center traffic in the Overview
We use two metrics to get an overview of the Help Center traffic - the total number of article views and the total number of searches.
Track the overall view count of Help Center content to determine how engaged users are - the higher the number is, the better, but for the full context, the results should be analyzed through comparison with other periods and in more detail in the Performance by article table.
You can see what the numbers were for the previous time range of your choice - if you filter your results to 1 month, the from value will show the data for the previous month. You can also see the change in percentages.

You can also cross-reference this data with your Support Performance Overview - if the number of article views is decreasing and your Tickets created metric is at the same level or on the rise, it's recommended to improve the content.
If you notice that the number of searches has grown, and the number of article views is dropping, it might be best to rephrase some of the articles. That can be confirmed in the Search results section.
A higher number of article views with a decreased number of searches might point to good SEO and well-structured topics.
Detect trends with Article views
The Article views graph will break down the overall traffic by time increments, so it helps you identify the shoppers' tendencies.
If you notice that the article views are higher on weekends than on weekdays, this most likely means that the visitors are more inclined to shop on weekends. If the graph shows a spike at a certain time of the year, this can help you prepare for the same period in the following year.
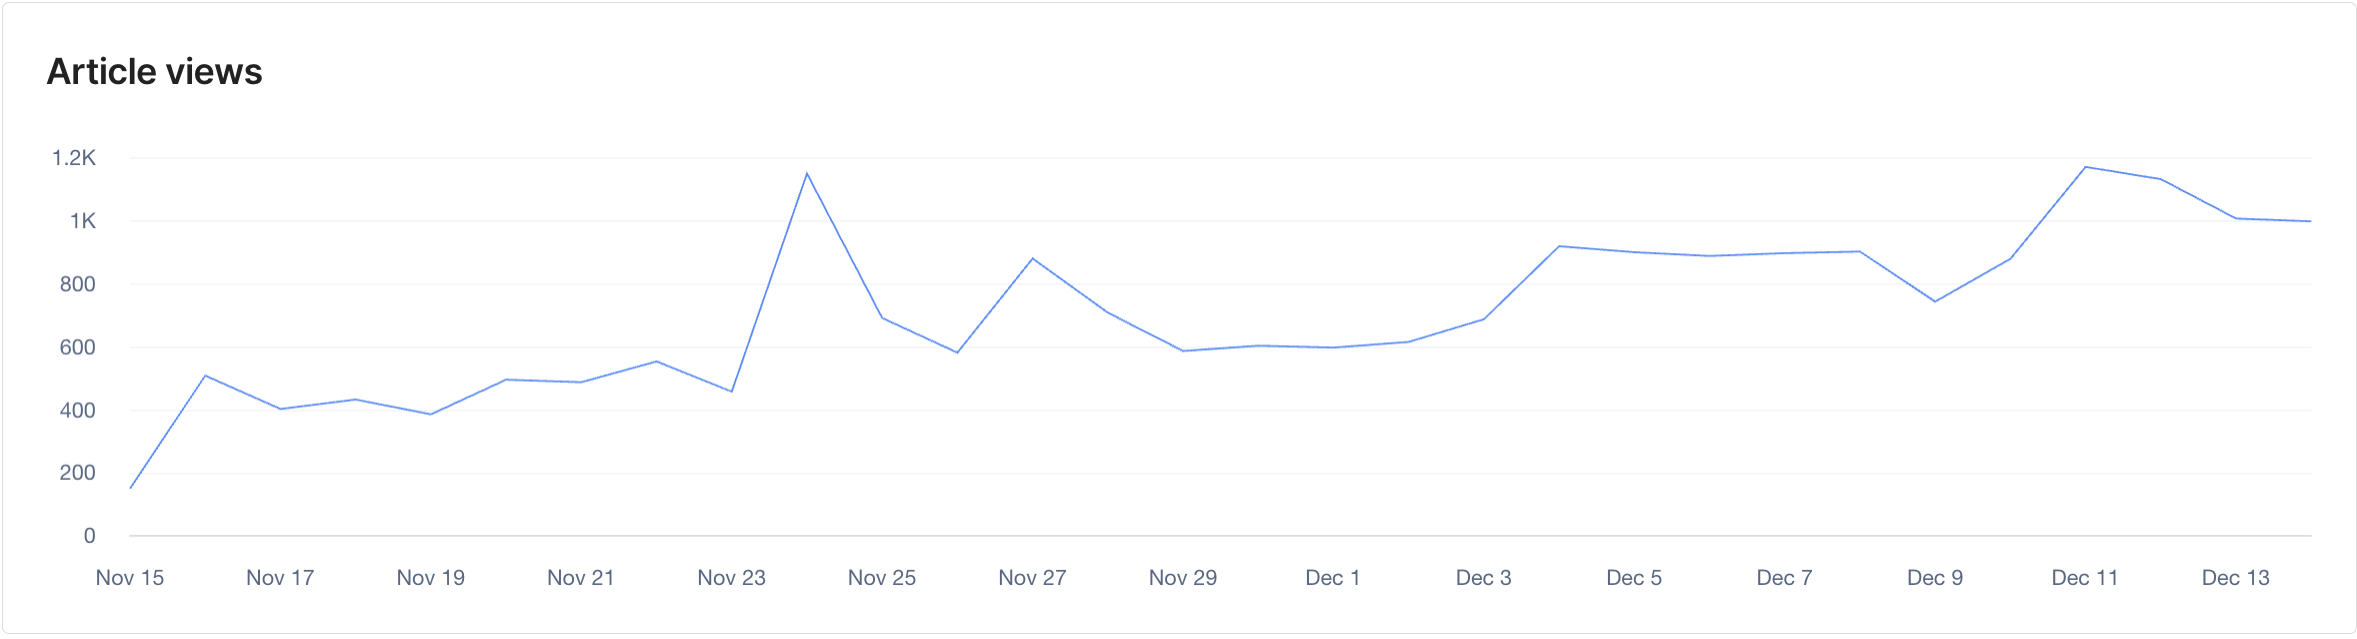
If your selected timeframe is less than 15 days, the graph will show day-by-day traffic. The intervals will increase as the filtered period gets longer.
Drill down the data with the Performance by articles table
The Performance by articles table will show you the most visited articles complemented with visitors' ratings. Of course, the goal is to have a high number in the Rating column, as it indicates the percentage of customers who left positive feedback on the article compared to the total number of feedbacks.
If the two metrics aren't aligned (your most viewed articles don't have a high rating), this calls for an article review - the information may be outdated, the structure may not be clear, or the tone of voice may not be suitable for your visitors.
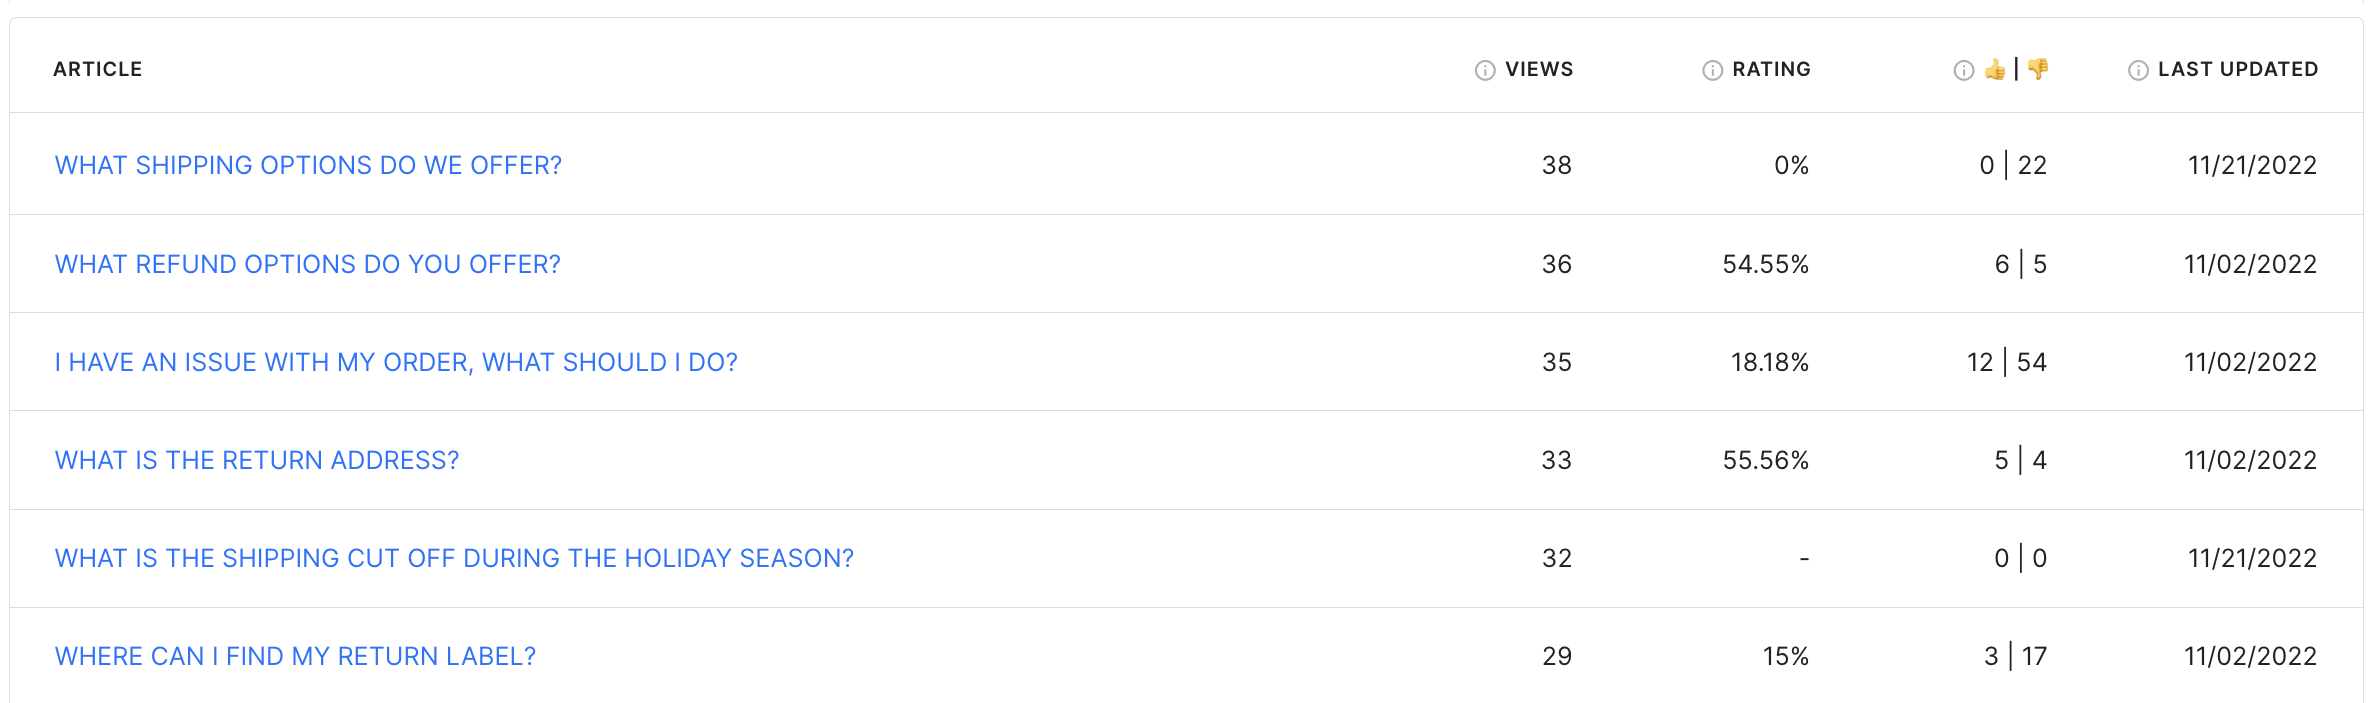
The last column will display the date when the article was last updated, so you can easily validate the content of popular articles that haven't been updated recently.
Comparing data from different time periods helps you get more details on possible seasonal trends among the visitors to your website.
If you're using your help center as a storytelling hub through blog posts or similar types of content, you will immediately spot topics that spark interest. Expanding on these or using them in your marketing campaigns can help attract new visitors and generate revenue.
Tracking the data in this table will also show you if the changes that you make to your articles are good - improvement in ratings means that it definitely resonated with the visitors of your website and possibly even increased their engagement.
Reveal possible gaps in Search results
The Search results graph shows the distribution of total searches resulting in articles shown to the user vs. no search results. 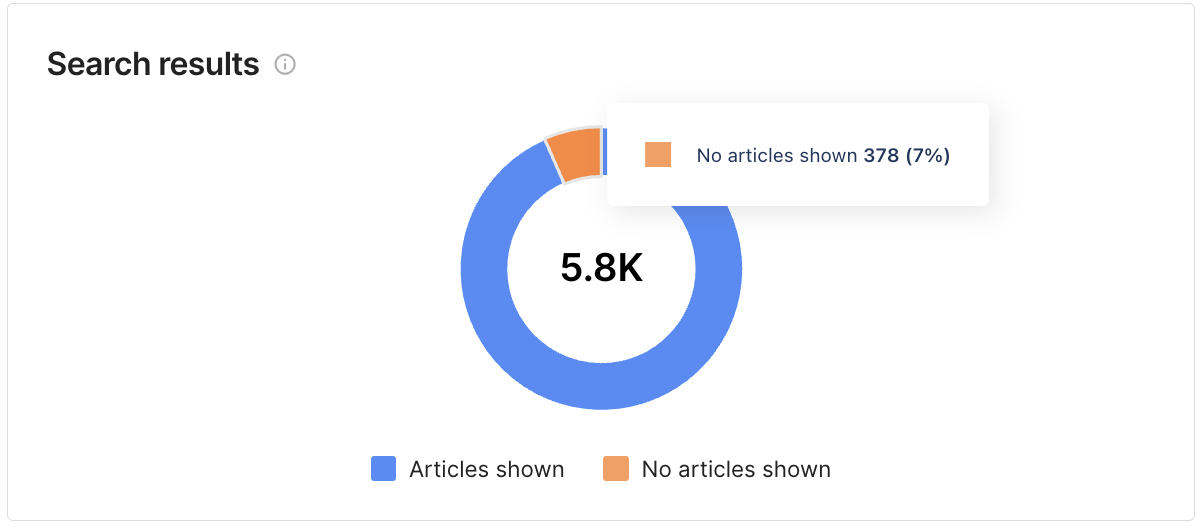
Hovering over the ring will give you exact numbers for each of the two categories. If the orange part has a high percentage, it shows that there are some uncovered topics in your Help Center that the visitors show interest in.
To get more insight on what's missing, you can analyze the No search results table where you'll see all the queries that didn't return any results - that can be your guide on what kind of content your shoppers expect to find.
If there's content in your Help Center that would've responded to these queries, it suggests a need to optimize article titles, descriptions, and keywords for improved search visibility.
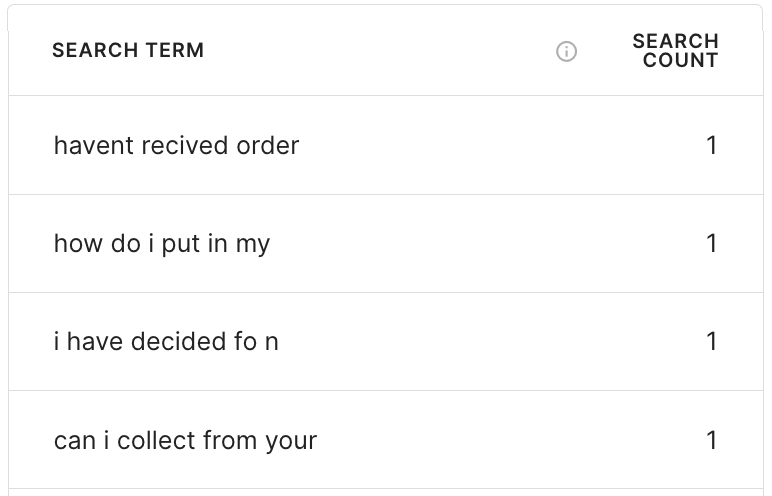
Anticipate user needs through Search terms
Analyzing the Search terms with results table over time, you can identify emerging trends in shoppers' search behavior. This can guide content creation, highlight new topics of interest, and address evolving customer needs.
Even though their queries generated results, there's always a possibility to provide more aspects on topics and bolster engagement. You can check the articles clicked in the pop-up window. If they match the articles that show low ratings in the Performance by articles table, you can gain more insight into what the customers expected to see when they clicked based on their exact query.
Besides showing how many times a certain term was searched for and what articles were clicked on, this table also provides information on the Click-through rate which refers to the percentage of search sessions where there was at least one click on a search result. In other words, this shows how informative and appealing your article titles and excerpts are.
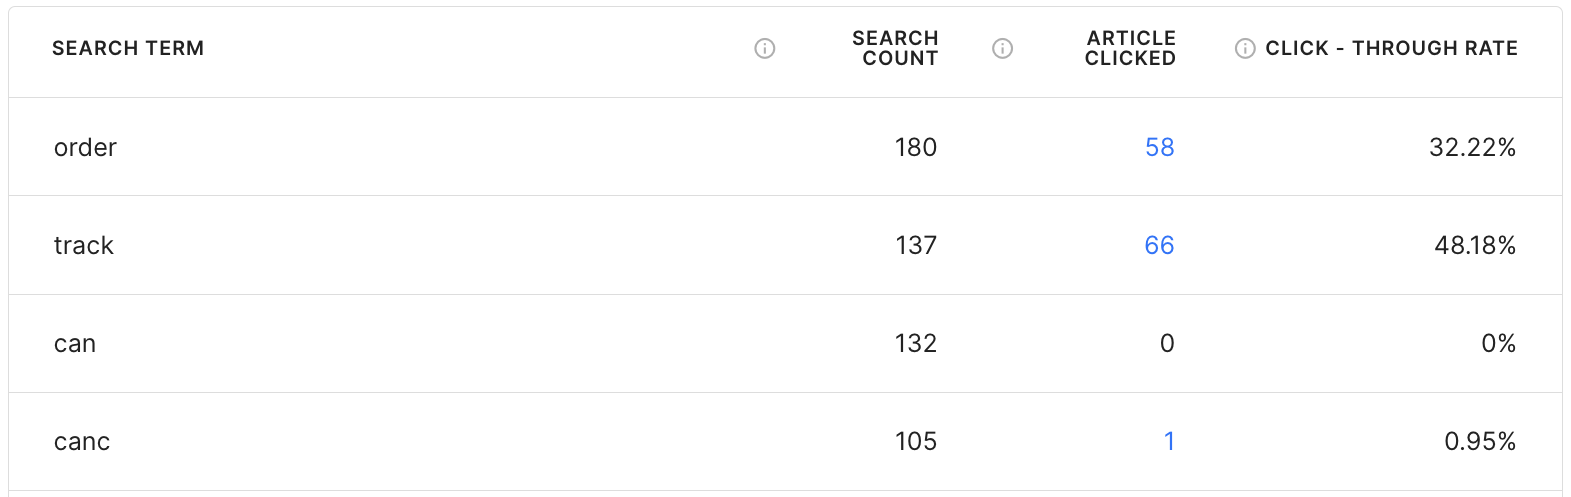
If your Click-through rate is low, especially for those queries that provide answers to what the visitor searched for, we recommend making the title more specific or more attractive for blog posts.
It also helps to give a short overview of the article content in the excerpt, so visitors can see straight away if they can find the information that they're looking for. SEO-optimized excerpts also help with the indexing of your articles in popular search engines.
On the other hand, if your Click-through rate is higher than 100% it means that the visitor decided to open several articles in separate tabs.
