Help Center StatisticsUpdated 6 months ago
This report enables you to optimize content, explore popular queries and search trends, amplify shoppers' experience, and make informed, data-driven decisions.
Navigate to Statistics -> Support Performance -> Help Center and pick a time period. It'll be automatically set to the last 7 days by default, but you have the option to select the timeframe of your choice - up to 1 year at a time.
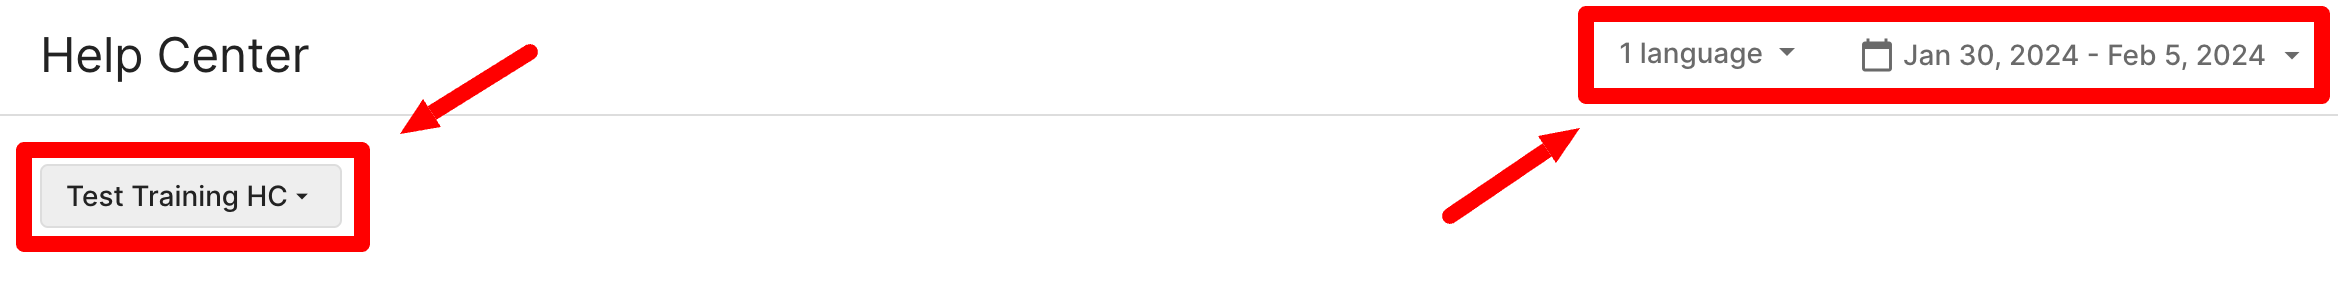
You can choose the Help Center whose data you want to see by selecting it from the drop-down menu at the top of the screen and you'll have the option to filter the data by the language supported by your Help Centers.
Features
Overview
This section highlights Article views and Searches.
Article views indicate how many times articles within the Help Center have been viewed. It's calculated based on the total number of article views (including duplicate views by the same shopper).
Insights that can be gained from this metric include:
- Popular content: identifying which articles are frequently viewed, that will denote topics that are of high interest to shoppers.
- Shopper engagement: tracking the overall view count of help center content to determine how engaged shoppers are.
Searches show the total number of searches performed by shoppers within the Help Center.
Insights that can be derived from this metric include:
- Shoppers needs: understanding the most common topics or questions visitors are searching for, so the information can be prioritized based on that.
- Search effectiveness: a high number of searches could indicate that customers are having trouble finding relevant information and that the content needs to be adapted.
Performance
This section will provide more detailed information about each category and article.
The Article views graph will help you understand an article's effectiveness during the selected period - you'll see when your articles have been viewed the most, so you can track seasonal trends and align content with your customers' needs.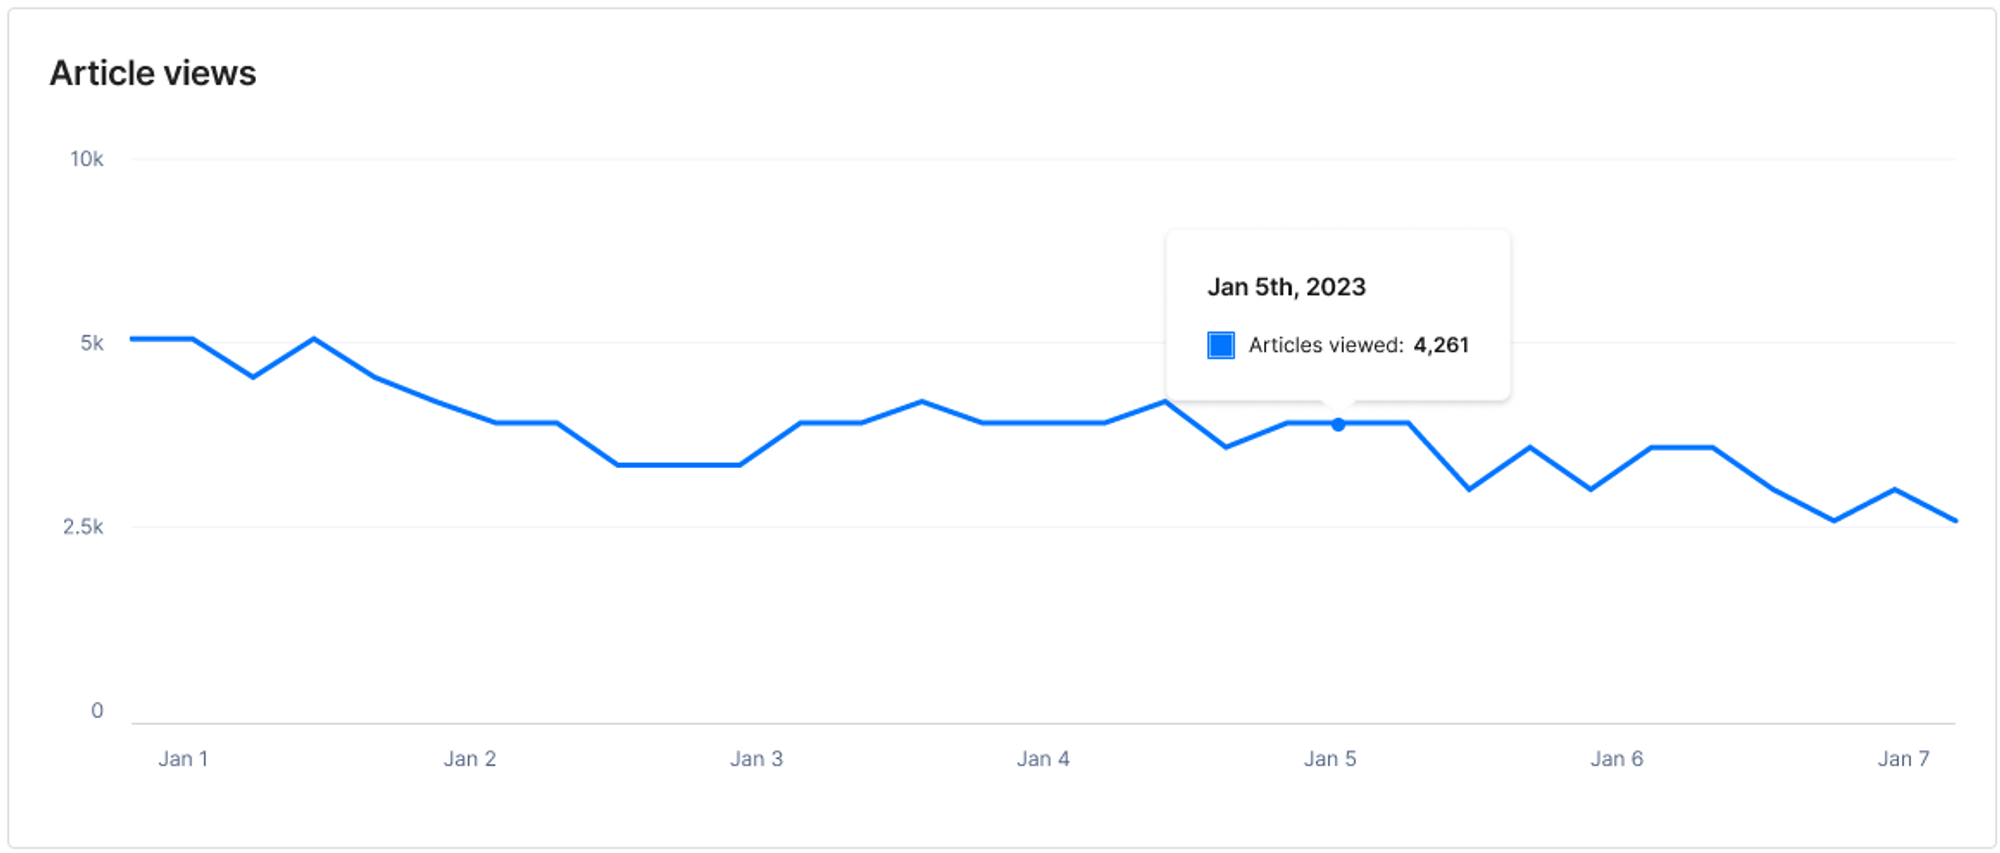
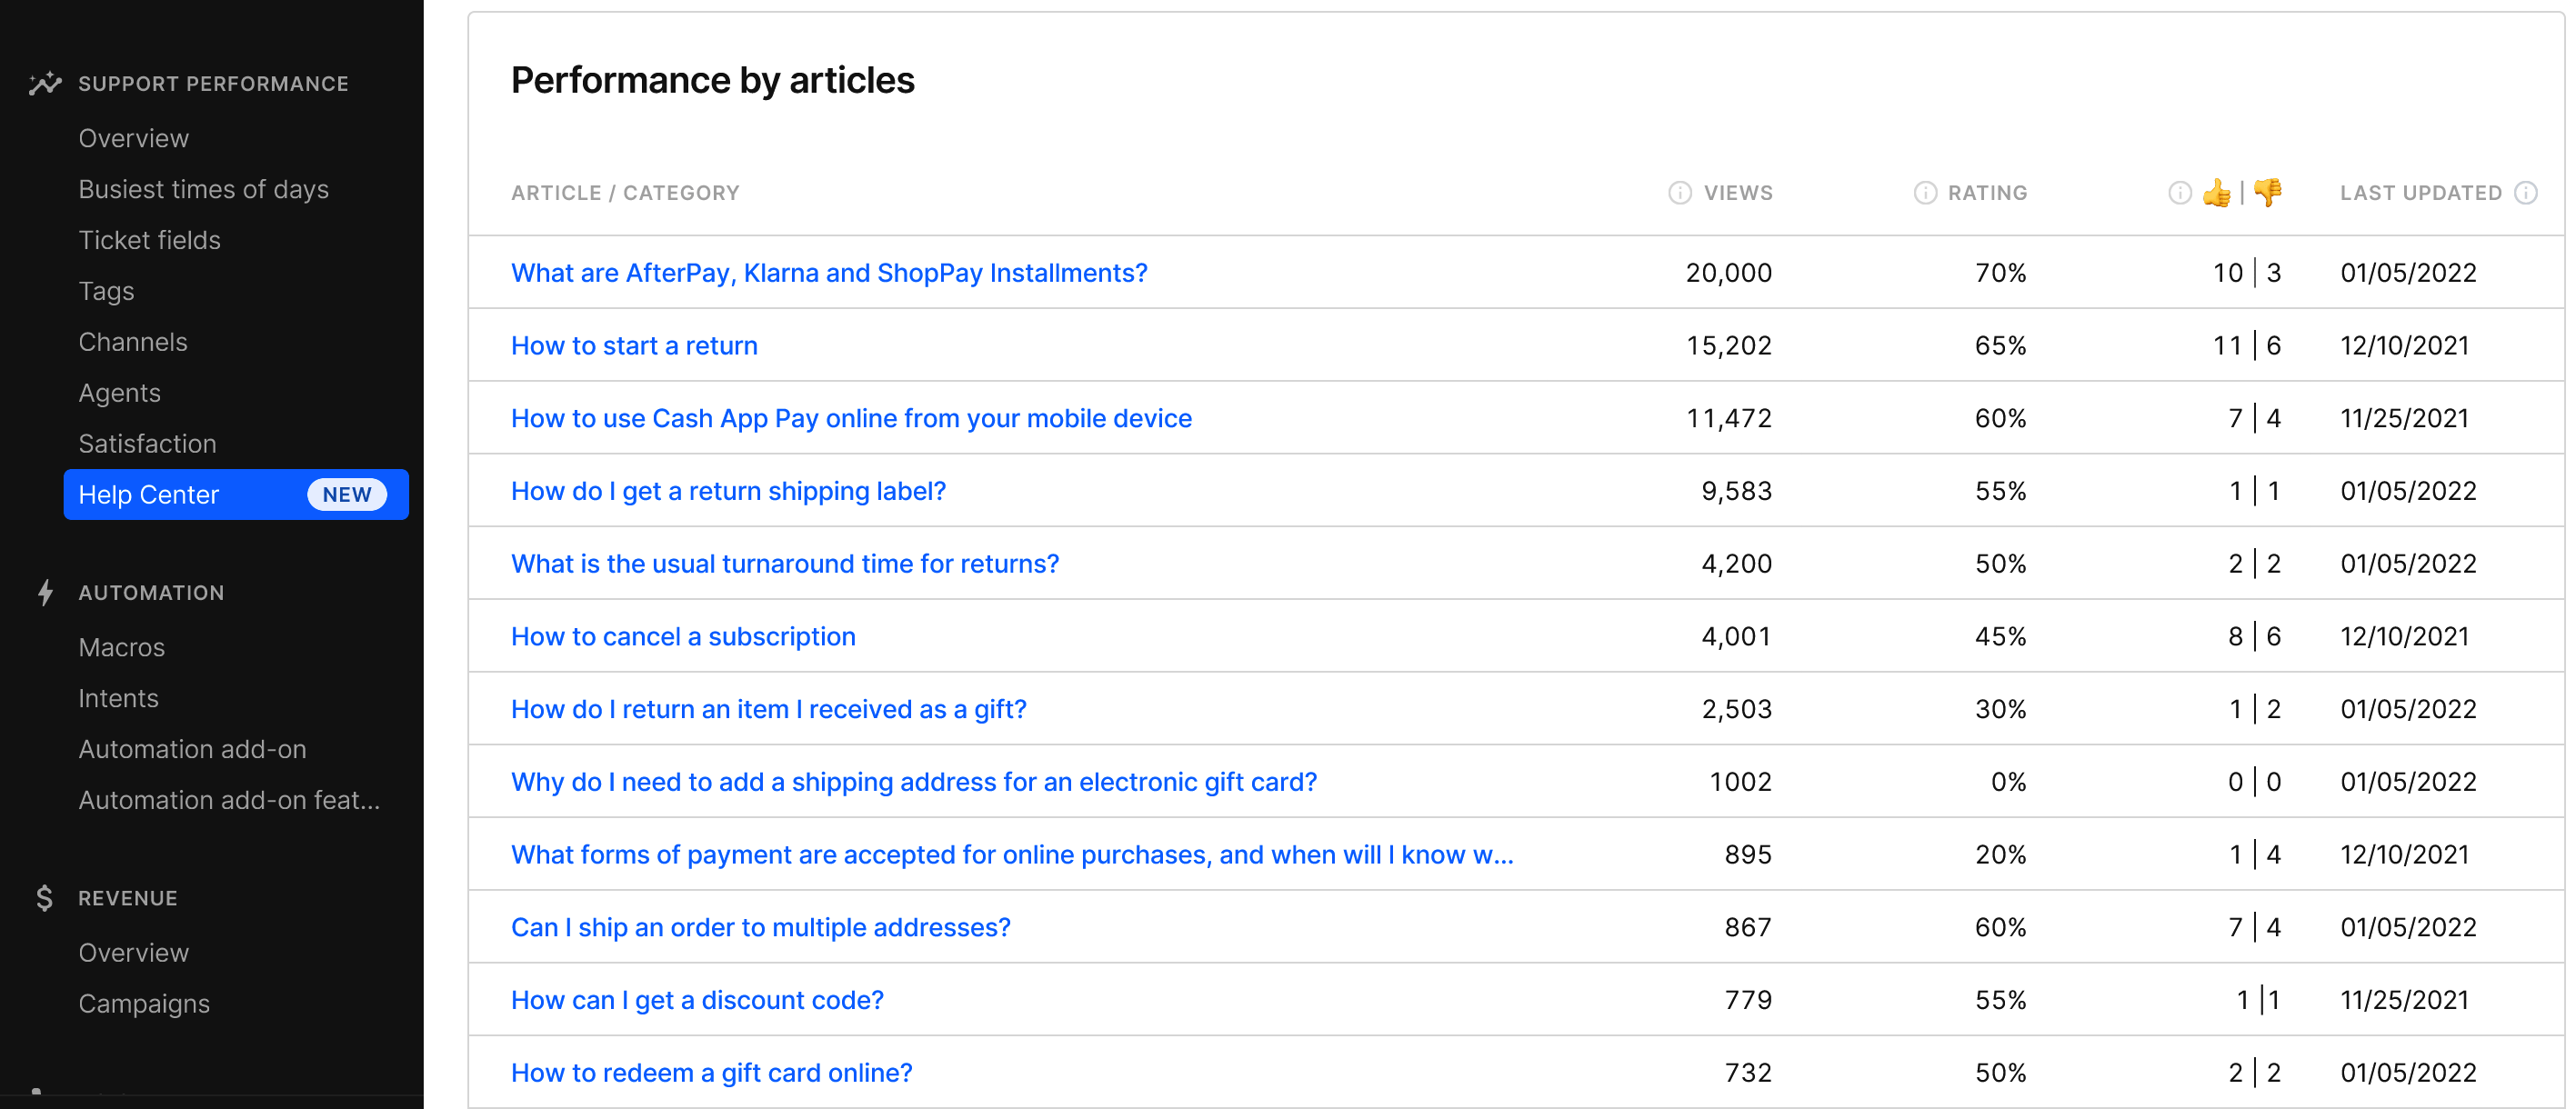
Performance by articles is a table that will break down data for each article based on the following metrics:
- Views: total number of views, including duplicate views by the same shopper
- Rating: quality of article calculated by: (% of thumb-ups) - (% of thumb-downs) from all ratings received
- 👍 / 👎: number of positive reactions compared to negative
- Last updated: the most recent date the article was edited
Help Center Searches
The three table types that are presented here will show how your Help Center articles match the most frequent search queries.
This will give you more insights on shoppers' behavior - whether shoppers who receive search results are more likely to engage with the content and stay on the site longer, compared to shoppers who encounter no search results. It'll also provide helpful data on how to improve your Help Center content.
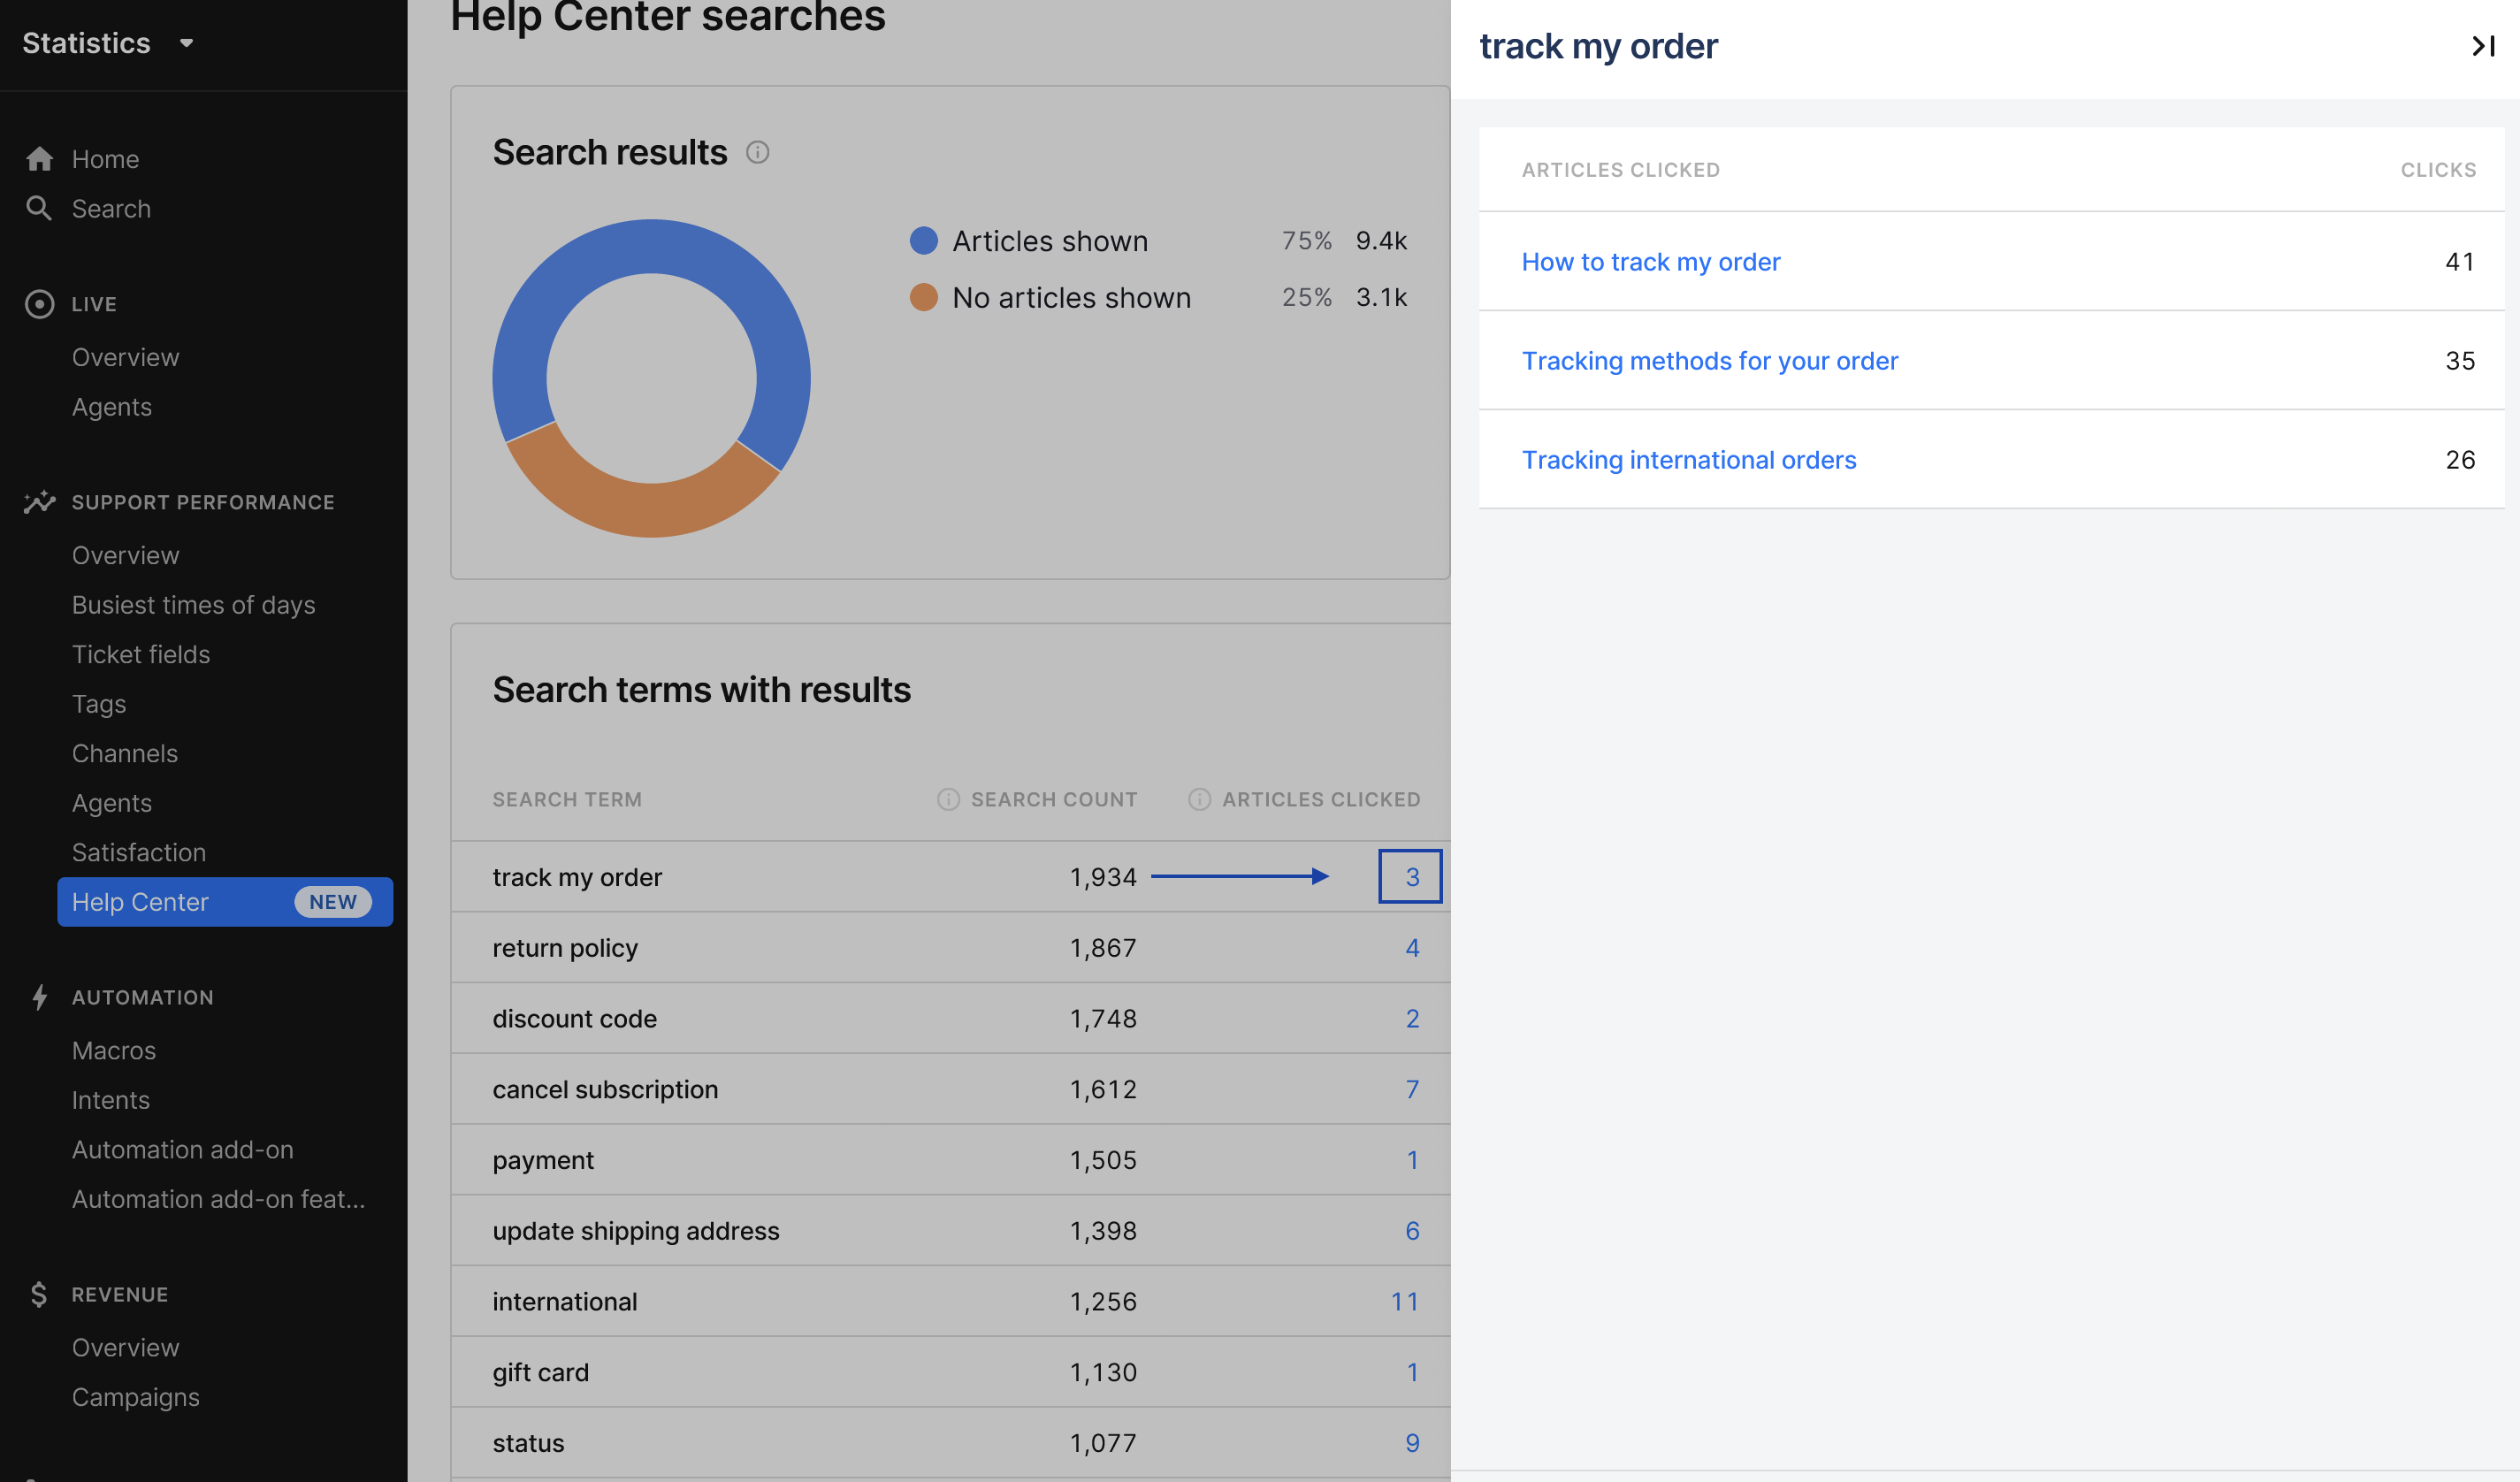
The Search results graph shows the distribution of total searches resulting in articles shown to the shopper compared to searches that didn't produce any results. 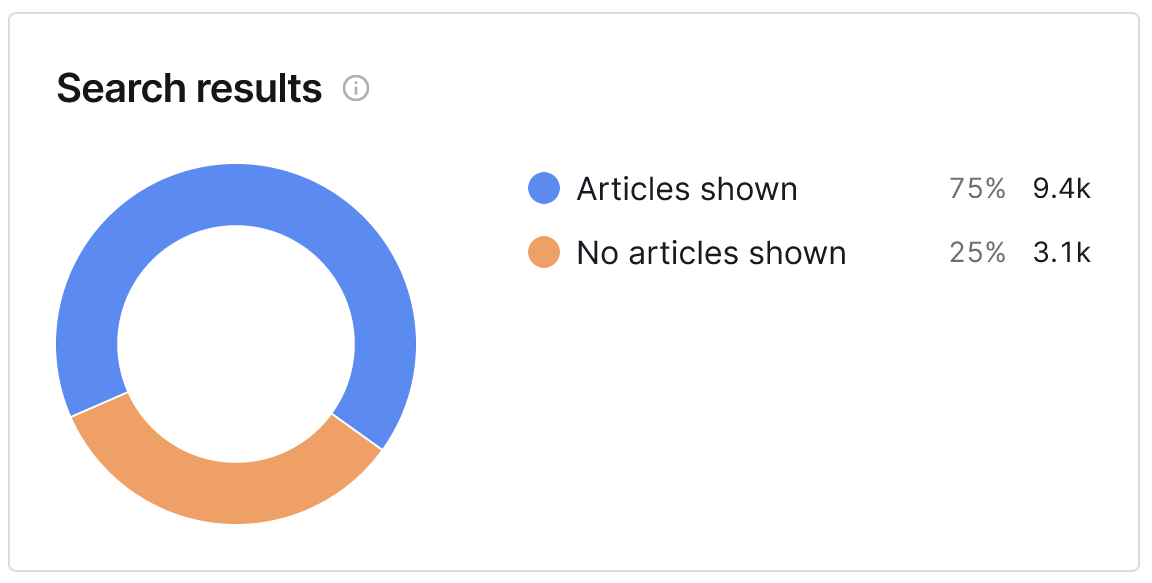
A high percentage of searches resulting in no articles can indicate shopper frustration because the wanted content wasn't shown.
The Search terms with results table shows the most searched terms with three different metrics:
- Search count: number of times the term was used in the search bar
- Articles clicked: number of unique articles that were selected from the results returned
- Click-through rate (CTR): percentage of search sessions where there was at least 1 click on a search result - higher CTR indicates that shoppers are finding relevant content in the search results
When clicking on Articles clicked result, a side panel will appear with the list of articles matched to the search term.
By examining the number of times a specific search term was used, you can identify the most popular or frequently searched terms. This can indicate which topics or questions are top of mind for shoppers. Through click-through rate, you can conclude if their search was successful.
Also, if you analyze the Search terms with results table over time, you can identify emerging trends in shoppers' search behavior.
No search results table shows the most searched terms that didn't return any articles. The data is listed by the number of searches. 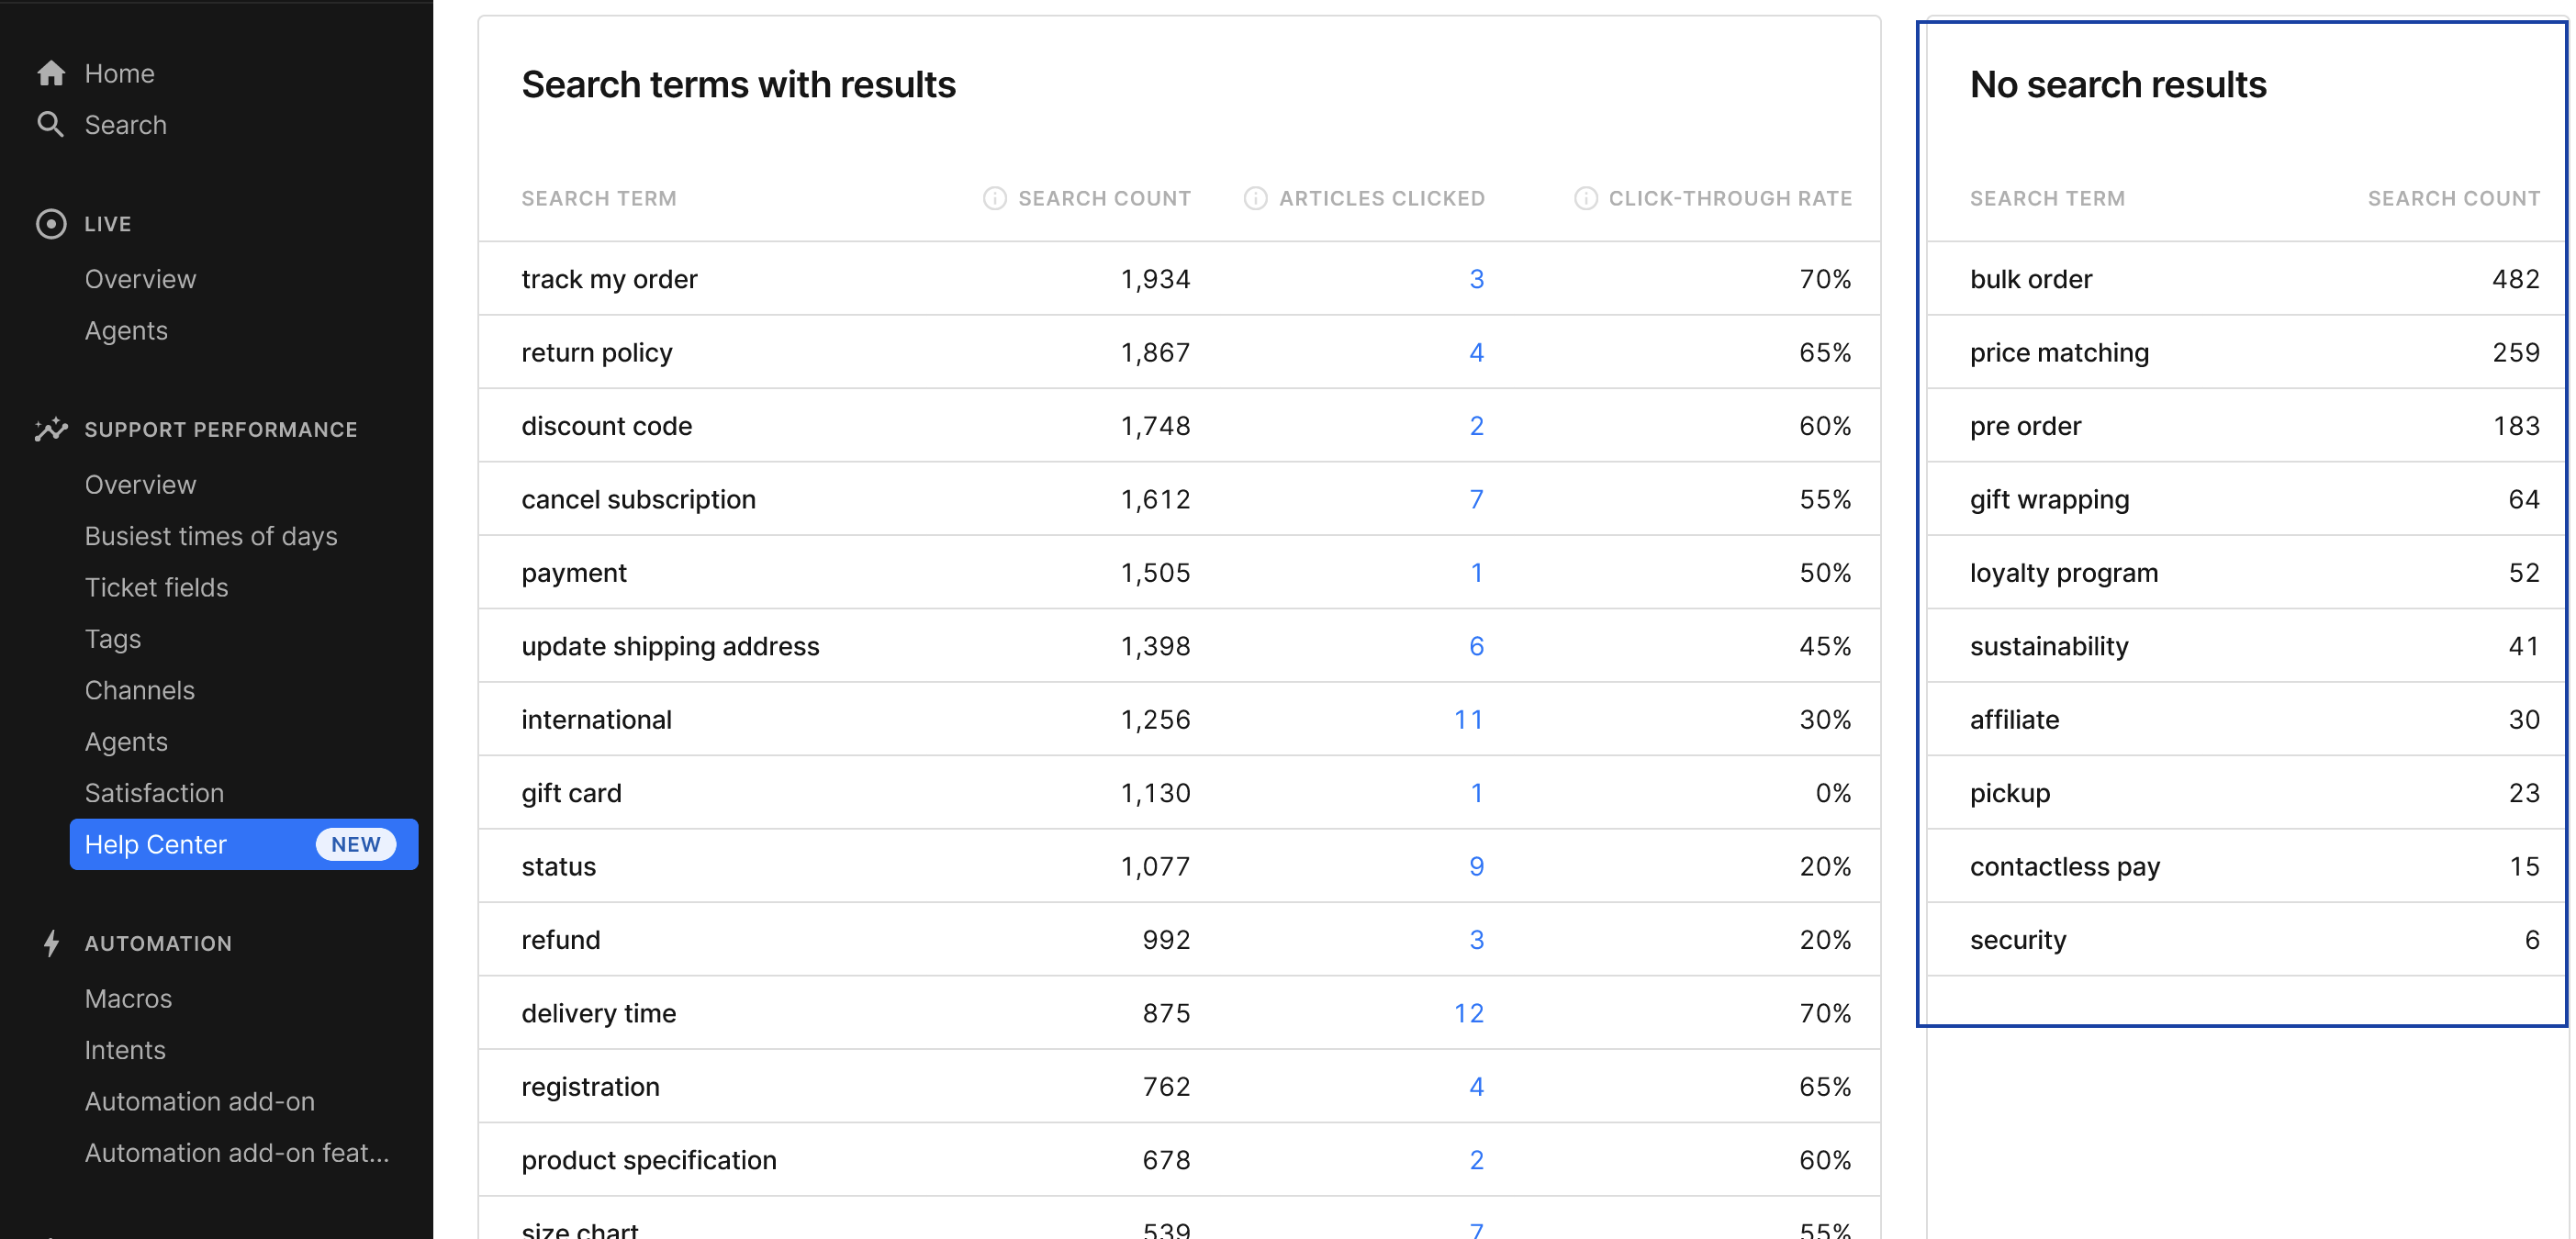
This table can give you an idea of how to improve the content of your Help Center - which articles and topics to add. If relevant articles exist but are not being shown in search results, it suggests a need to optimize article titles, descriptions, and keywords for improved search visibility.
Limitations
- You can't export this report yet
- We don't display the number of deflections from articles
- The sources of traffic are not shown in this iteration
- Categories in the Performance by article table aren't displayed currently
FAQs
Why can't I see my Help Center stats?
The Help Center Statistics dashboard is available for all accounts that have at least one Help Center created and enabled in Gorgias, with at least one article published. You can check the status and the content of your Help Center in Settings -> Channels -> Help Center.
If you have a help center enabled, please make sure that it's published on your website, either through embedding or redirect.
The data in the Overview and Performance sections will not visible if you are using 1-page layout.
If you still don't have any data displayed, please note that you may have selected a timeframe while your Help Center wasn't enabled/published. Alternatively, you may just need to refresh the page.
Can I see the stats for my Article Recommendations in this report?
If you have Article Recommendations enable, you can see stats for this feature in the AI Agent Overview and Automation Performance reports.
Can I see how many tickets were created from the Help Center?
You can see this with the Ticket Created metric in the Support Performance Overview dashboard - select Help Center in the Channel filter and make sure that no agents or teams are selected.
