Review automation performance by featureUpdated 3 months ago
The Performance by feature report shows you detailed information on how specific automations are performing, including Flows and Article Recommendations. You can also view important insights from Order Management, including your top reported product issues and most returned items.
You can use the report to understand where you need to refine your existing automations and identify opportunities to improve your CX operations and customer experience.
- Learn how specific Flows are performing, including the highest drop-off rates
- Learn which Help Center articles can be updated to improve your automation rate from Article Recommendations
- Learn what product issues your shoppers most frequently report, and which products they return the most (using data from Order Management)
Requirements
- You must have an active AI Agent subscription
- Any role in Gorgias can view this report (Observer → Admin)
- You must have Lead, Admin or Account Owner permissions to download data
Filtering and reading data
In the Performance by feature report, you can filter results by store (if you have more than one connected to Gorgias) to change your view of the data. You can also select CSV to export results from different parts of the report to a spreadsheet (you must have Lead or Admin permissions to download data).
- Open the Performance by feature report to access, view and download your data
- Go to Statistics from the main menu
- Under the AI Agent section, select Performance by feature
- Select the Store dropdown menu to filter results by your connected stores
- The Performance by feature report shows the total number of automated interactions for a given Flow or Article Recommendation
- Unlike the AI Agent Overview report, automated interactions are not de-duplicated after 72 hours. For example, if a shopper uses the same Flow more than once within 72 hours, each interaction is shown in this report.
Flow performance
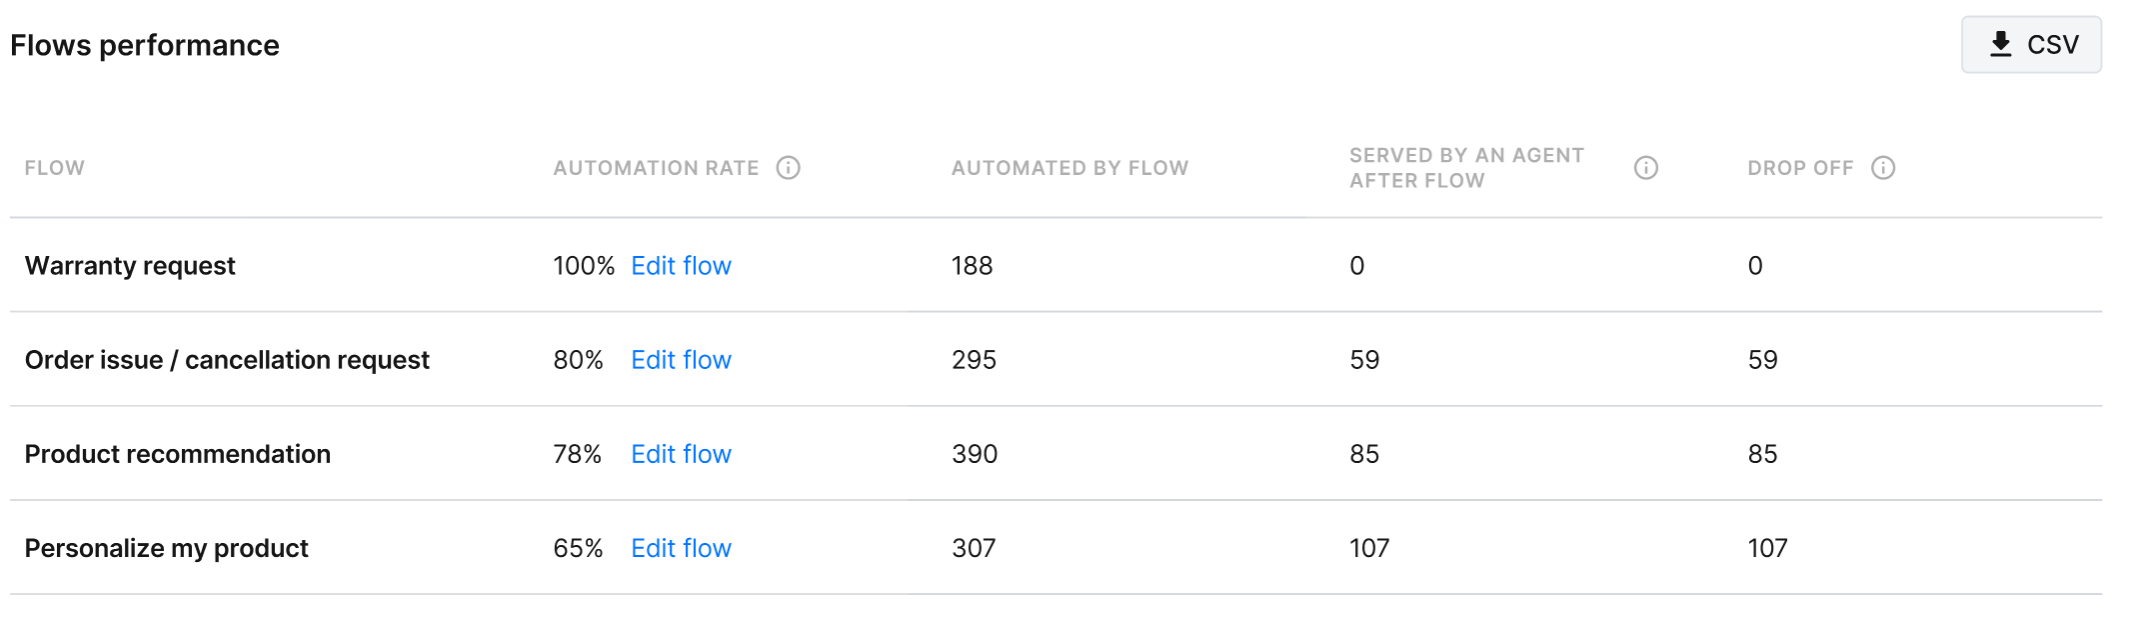
Automation rate
The percentage of interactions resolved by a Flow divided by the total number of times a user has started a Flow.
Select Analyze Flow to take a look at your Flow's drop-off performance in more detail, and identify opportunities to increase automated interactions.
Automated by Flow
The number of times the customer reaches the end of a Flow - in this case even if the customer leaves the Flow and doesn't click that the response was helpful, it'll be considered as a successfully automated Flow.
Served by Agent after Flow
The number of times the customer reaches the end of a Flow with the ticket being created, no matter if the customer indicated the response was not helpful or the Flow is designed to end by creating a ticket directly (without asking if it was helpful).
Drop Off
The number of times a customer has started a Flow but hasn’t reached the end - if the customer reaches the end of the Flow and doesn't respond to whether the response was helpful, it won't be considered a drop-off.
Article Recommendation performance
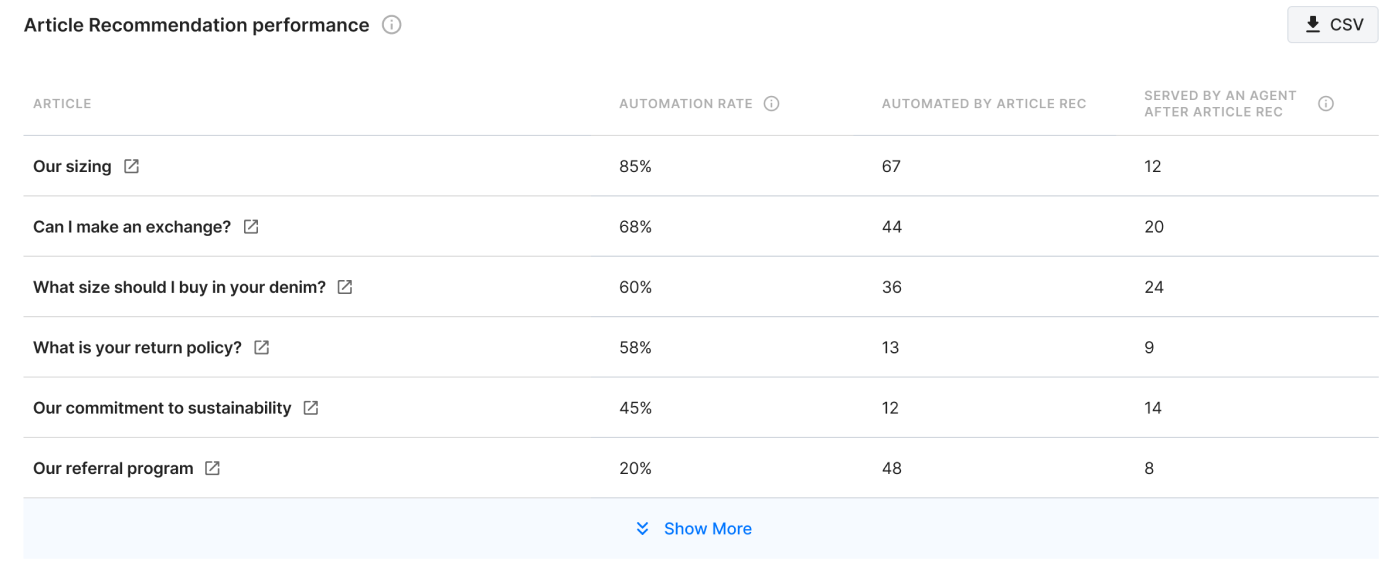
Automation rate
The percentage of interactions resolved by Article Recommendation divided by the total number of times a user gets the Article Recommendation.
Automated by Article rec
The number of interactions resolved by Article recommendation divided by the total number of times a user is recommended an article.
Served by an Agent after Article rec
The number of tickets created after an article has been recommended - this will happen If a customer isn't satisfied and asks for more help.
Top order issues reported (Order Management)
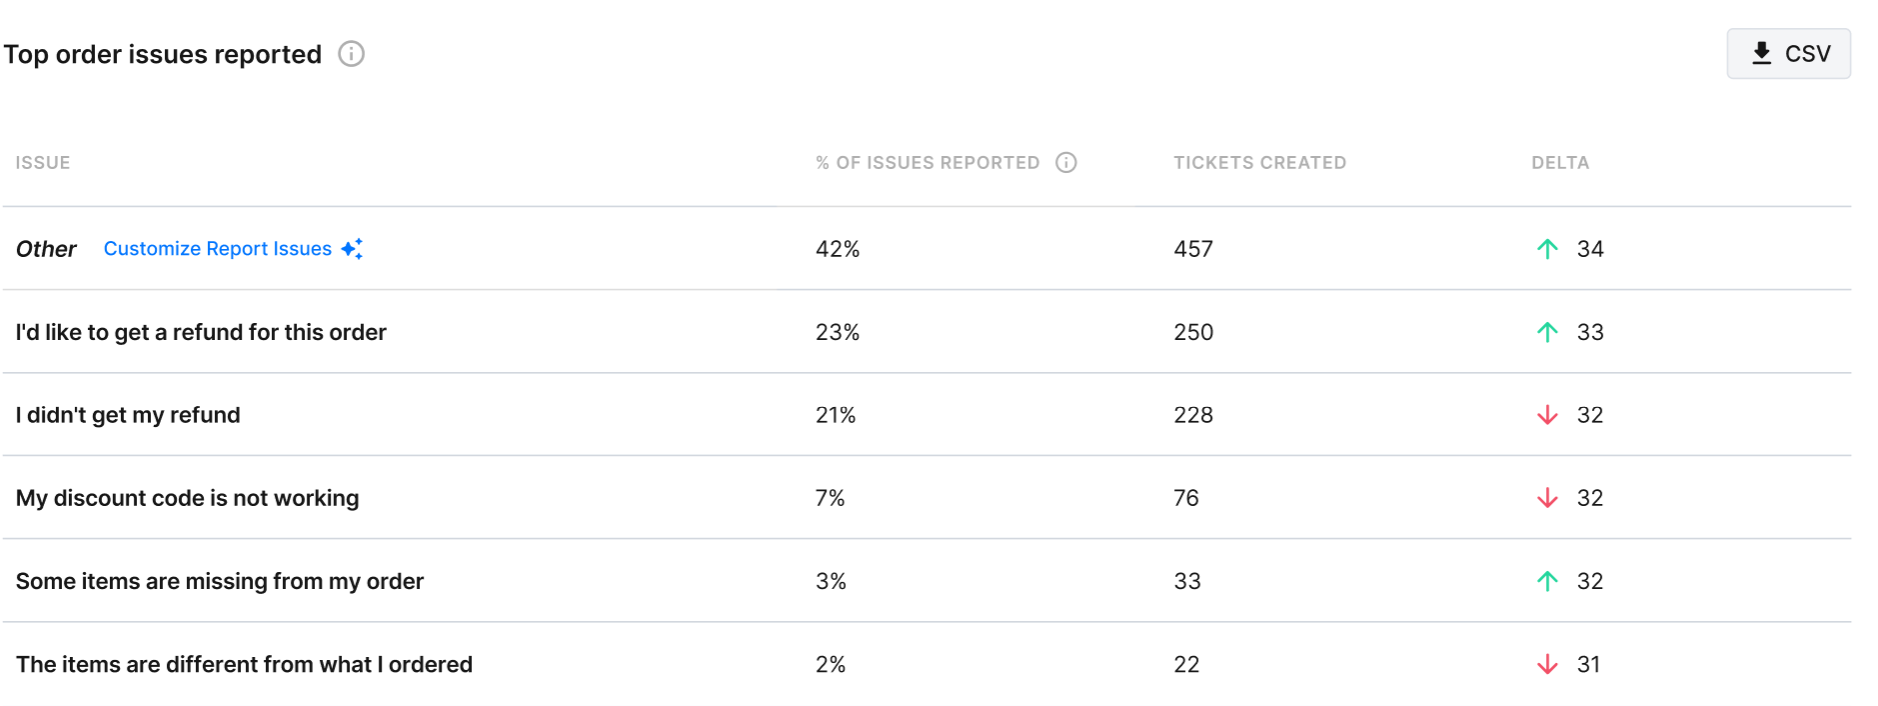
% of issues reported
The percent of issues reported out of all order issues reported through Order Management
Tickets Created
The number of tickets created after an issue was reported. If a shopper gets a response from Order Management set up and doesn't need more help, a ticket won't be created.
Delta
The volume difference between the selected date period and the same period before that (if the stats are filtered for the last 7 days, the delta will be the volume of that period vs the 7 days before that).
Products with the most issues and return requests (Order Management)
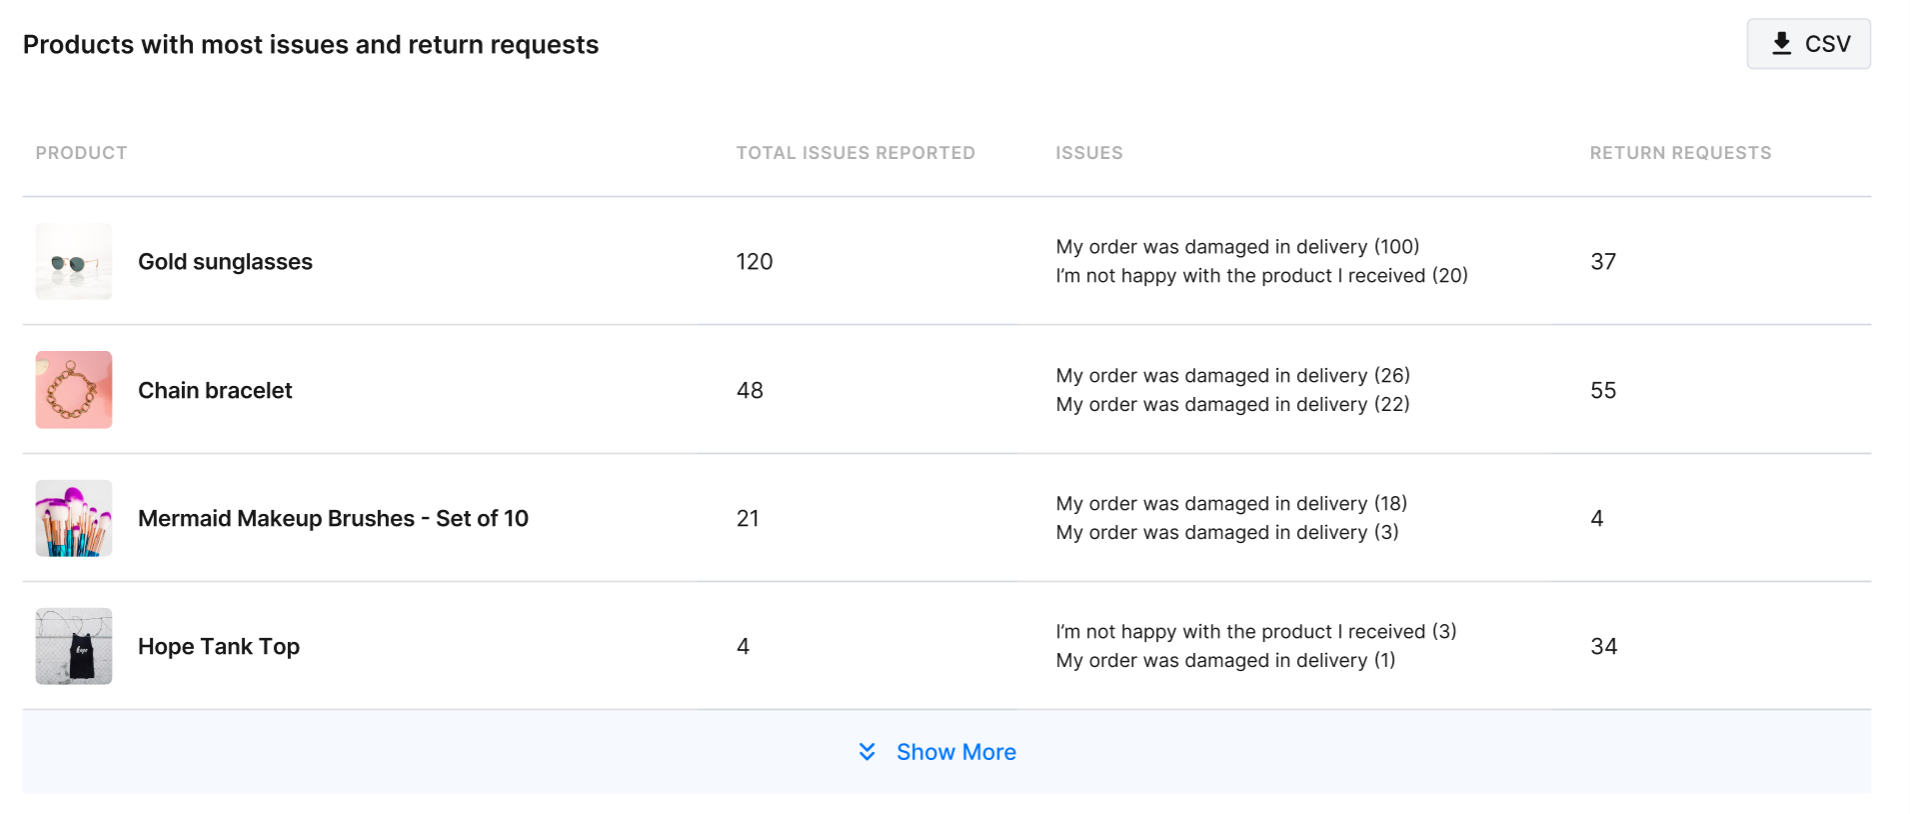
Total Issues reported
The number of issues reported through Order Management feature; this doesn't include return requests.
Issues reported
Options most frequently used through the Report Issue feature, including the number of times they're used.
Return requests
The number of returns requested that have created a ticket (if you have set up Order Management to use Loop Returns, those requests won't be included in this column).
