Automate Reports 101Updated 3 months ago
With Automate reports, Automate subscribers get a comprehensive overview of the impact of this product.
It encompasses the automation rate, along with benchmark insights, the tally of automated interactions within their chosen timeframe, and a calculation of the time saved for customers compared to not having the product - this data provides a transparent understanding of how Automate features enhance team efficiency.
You can find the Automate Reports Statistics -> Automate -> Overview.
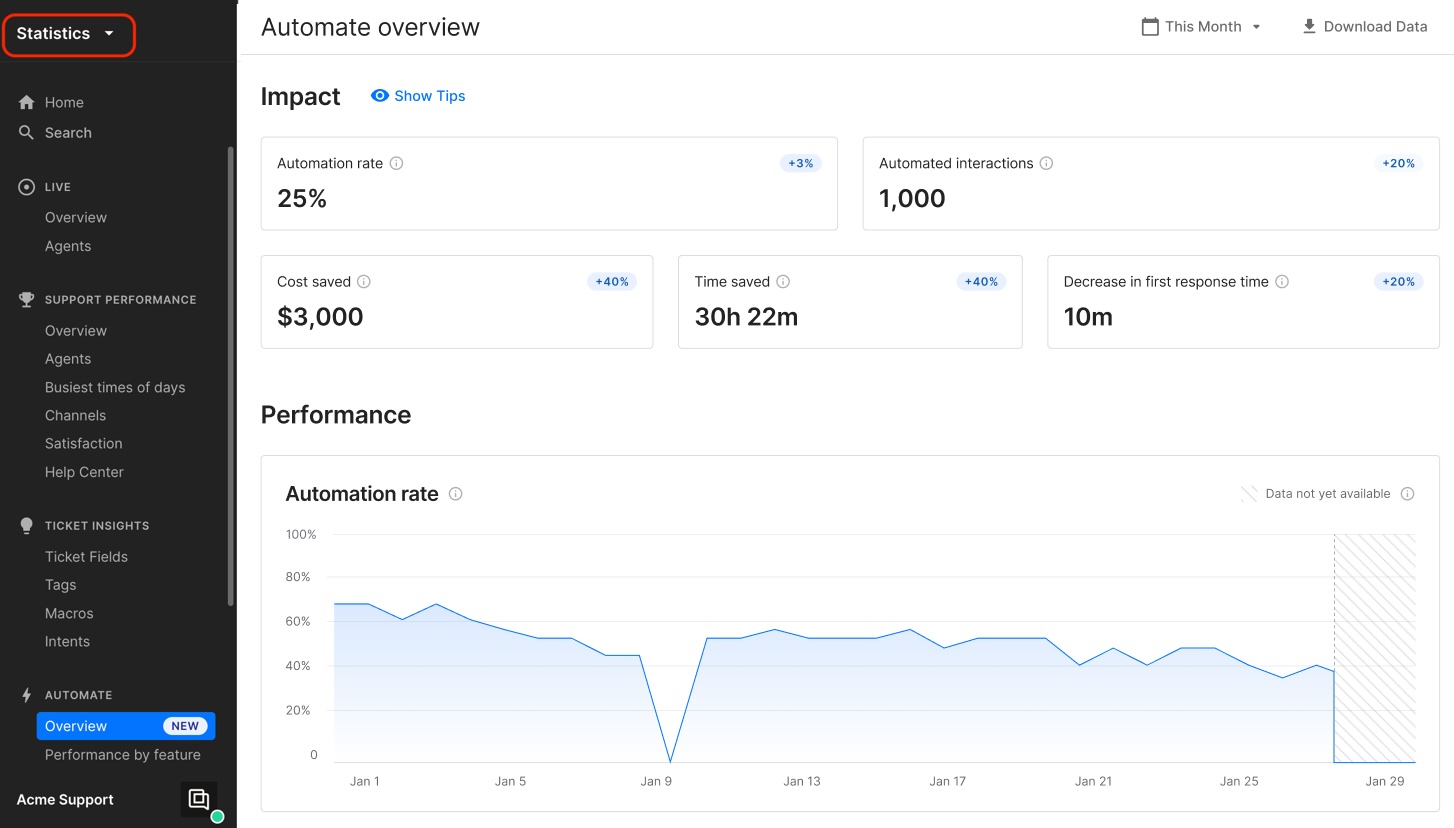
There are two dashboards included in these reports:
- Automate Overview - focusing on high-level impact and performance
- Automate Performance by feature - delving into specific feature performance
Overview
Here's the logic of how data is displayed and the main terms used when explaining how the metrics are computed - Customer interaction and Automated interaction.
How data is displayed
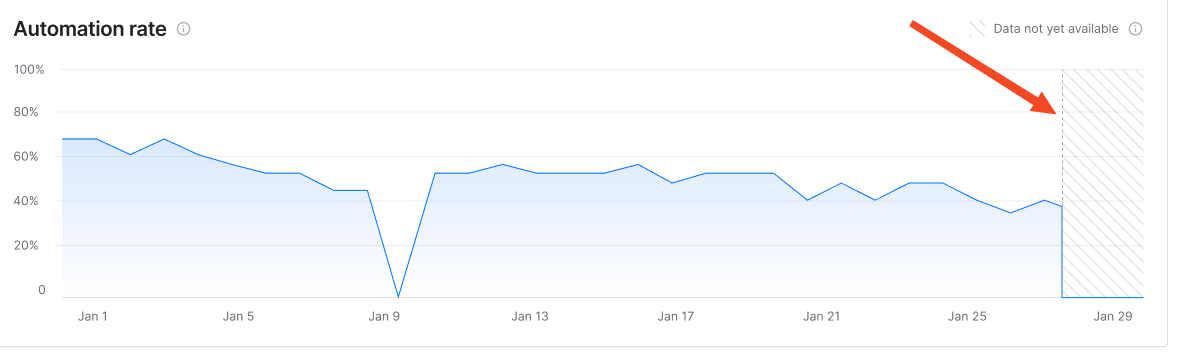
All metrics in our report take into consideration the interaction's starting event, as opposed to the confirmation event - if you're looking at your January 1st metrics, you're looking at interactions that started on January 1st. However, if not more than 72 hours have passed, the data won't be shown.
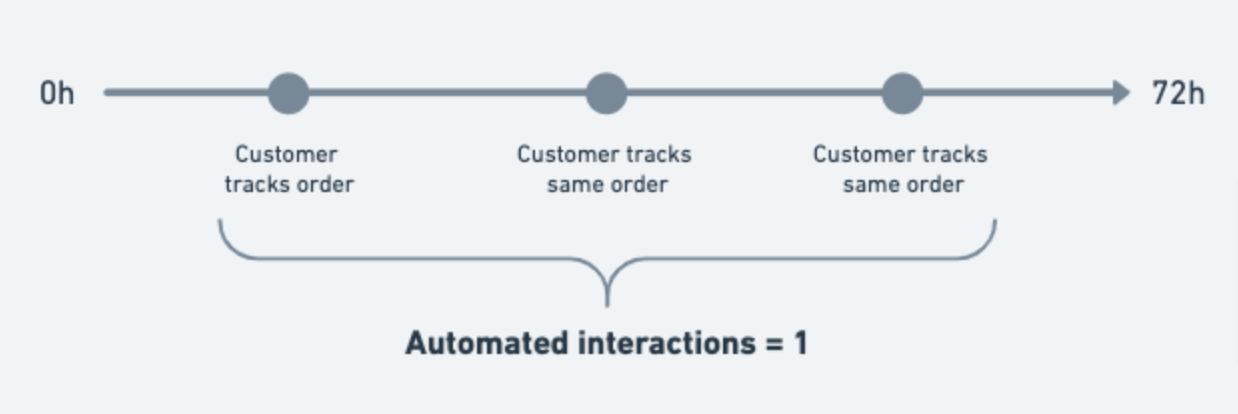
This is how we consolidate interactions in which the same customer is answering the same question via Automate, like tracking an order. We do this to avoid counting multiple automated interactions when in reality the question answered was the same (for example, somebody checking their order tracking).
In practical terms, this means that when an interaction is automated, we wait 72 hours to de-duplicate cases in which a customer tries to answer the same question. Then we'll report the consolidated count.
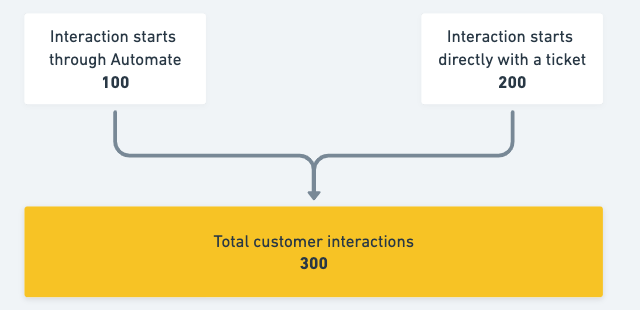
Customer interaction
A customer interaction is any exchange of messages that has occurred between you and your customer. The messages sent to your customers can come from a human (ticket handled by an agent) or a machine (Flow).
In other words, customer interactions reflect every touchpoint between your customer and your brand, no matter how it was responded to.
Automated interaction
An automated interaction is when a customer solves their request without human intervention using a feature from Gorgias Automate.
There are 2 main ways in which we determine that an interaction is automated:
1. A customer creates a ticket, it triggers a message from an autoresponder, and there's no message from the customer after 72 hours.
2. A customer uses one of our Automate features (Flows, Order Management, Article Recommendation) and it doesn't result in a ticket being handed over to an agent - if a customer starts a multi-step Flow, but doesn't reach the end (drop-off), this won't be considered an automated interaction.
As mentioned above, we take into account unique automated interactions on a 72-hour rolling window.
Performance by feature
This report is currently based on our legacy data source which is why summing up data from the Performance by feature section won't match the metrics in the Overview report.
How data is displayed
There's no 72-hour hold-up with this report - as soon as the appropriate interaction takes place, it'll be reflected in relevant metrics.
The automation rate for each feature takes into account only interactions started through that feature. For example, the automation rate of a “What size should I pick” Flow will be 50% if half of the customers that started the Flow didn't ask for more help, regardless of the total number of overall customer interactions.
The number of interactions is not de-duplicated as it is in the Overview report. This means that if the same shopper starts the same Flow multiple times within the same day, each of those interactions will be counted in metrics that reflect it.
FAQs
Do tickets resolved by a Rule count as automated interactions?
No - an interaction is only considered automated if no ticket was created. Rules are a Helpdesk feature, not an Automate feature.
What's the difference between the Overview report and the Performance by feature report?
The Overview report is meant to provide a high-level view of the performance of Automate and the impact on your CX operation.
The Performance by feature report goes a level deeper and helps you answer how specific Automate features are performing.
If I add in the totals of the Performance by feature report, they don't match the numbers in the Overview report. Why is that?
You may encounter differences in the numbers between these reports. There are 3 main reasons:
- The Performance by feature report doesn't include metrics for interactions automated by Autoresponders and the Track Order option.
- The Performance by feature report is powered by our legacy data source while the Overview report is powered by a more robust data infrastructure. As a result, there may be differences in the numbers between these reports. Over time, we'll be migrating all our reports to our new data infrastructure, which will ensure metrics are consistent across reports.
- The Overview report that's based on new data infrastructure de-duplicates interactions, while the Performance by feature report doesn't, due to a legacy data source.
Why is my automation rate lower compared to the previous Automate report?
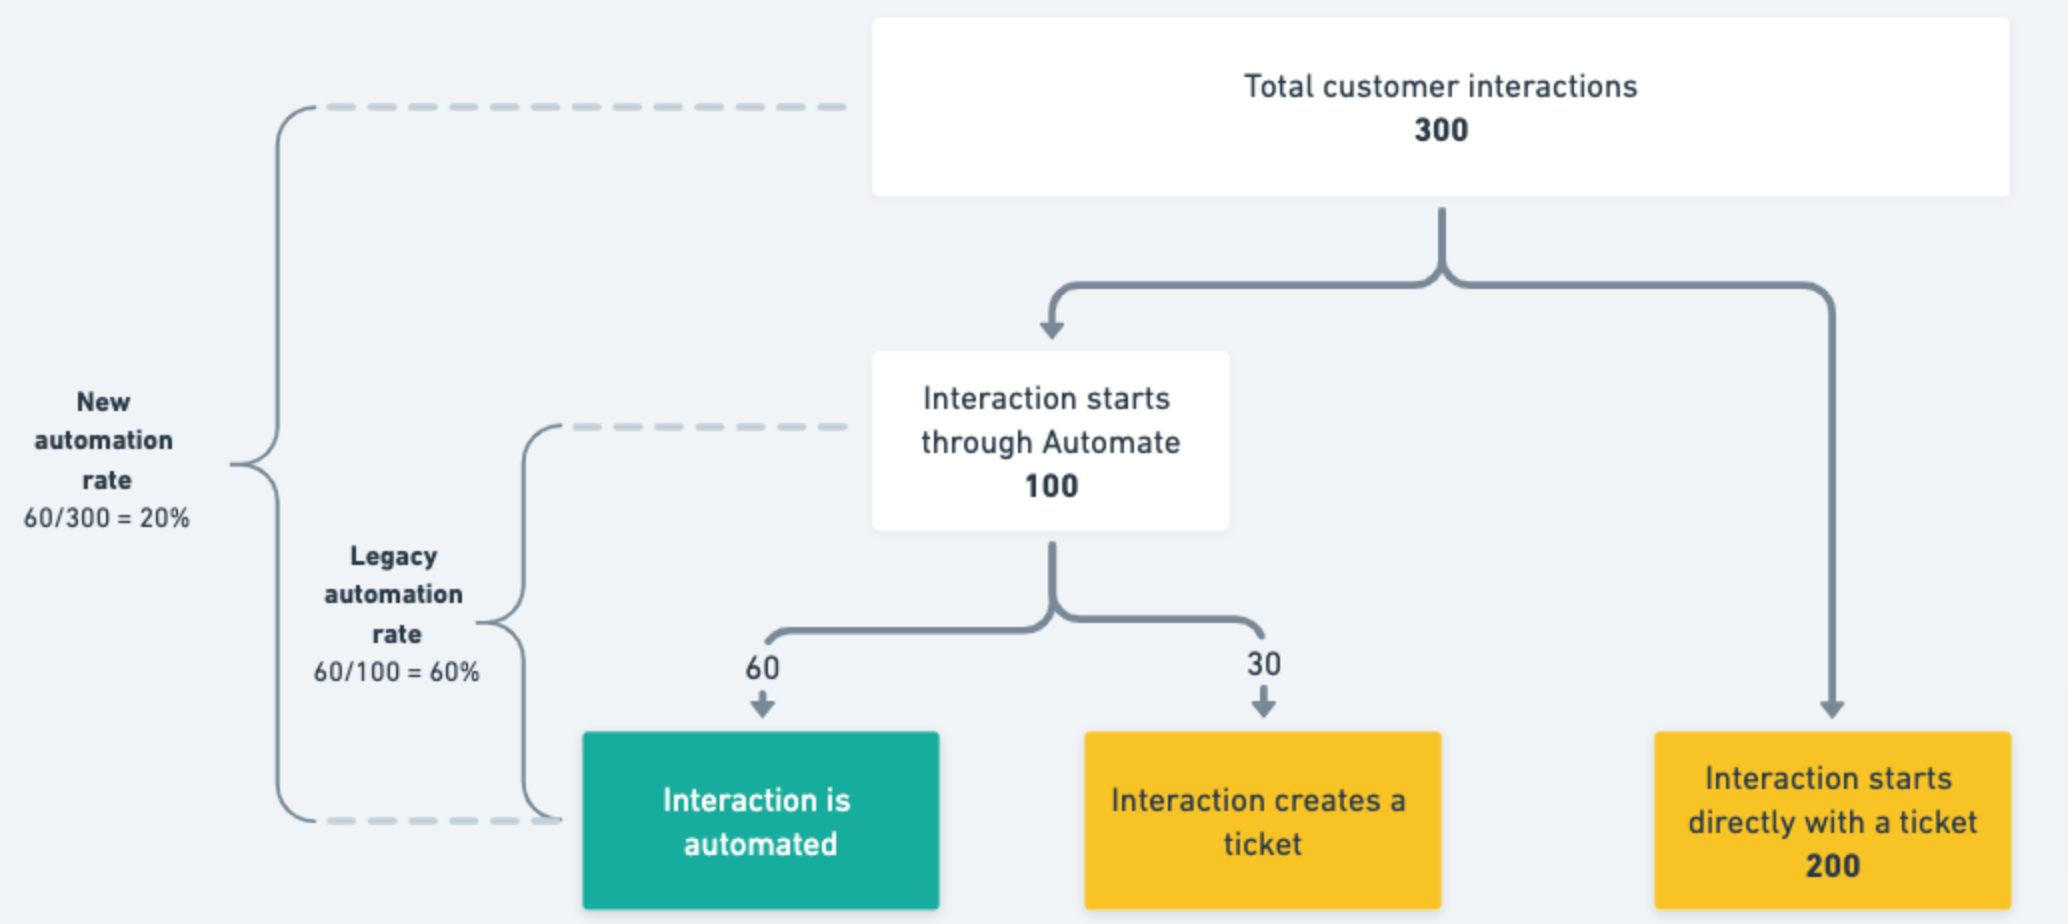
Compared to our previous statistics report, the way the automation rate is calculated has changed. Previously, we were calculating automated interactions as a % of interactions started through Automate. We've changed this to make sure the metric reflects the impact on your entire operation.
For example, you could have a 90% automation rate, but if only a small portion of your entire support volume is going through an Automate feature (say, 5%), then the actual value you’re getting isn’t significant even if the automation rate is seemingly high.
Here’s how the calculation has changed:
- Previous rate: (# of automated interactions / # of Automate interactions) * 100
- New rate: (# of automated interactions / # of total customer interactions) * 100
As a result of this change, it’s likely your automation rate is now lower compared to the previous report.